
Question. How do trace-observed decode speed and Codex residual TTFT estimates vary with the per-step input context length?
Question. How do trace-observed decode speed and Codex residual TTFT estimates vary with the per-step input context length?
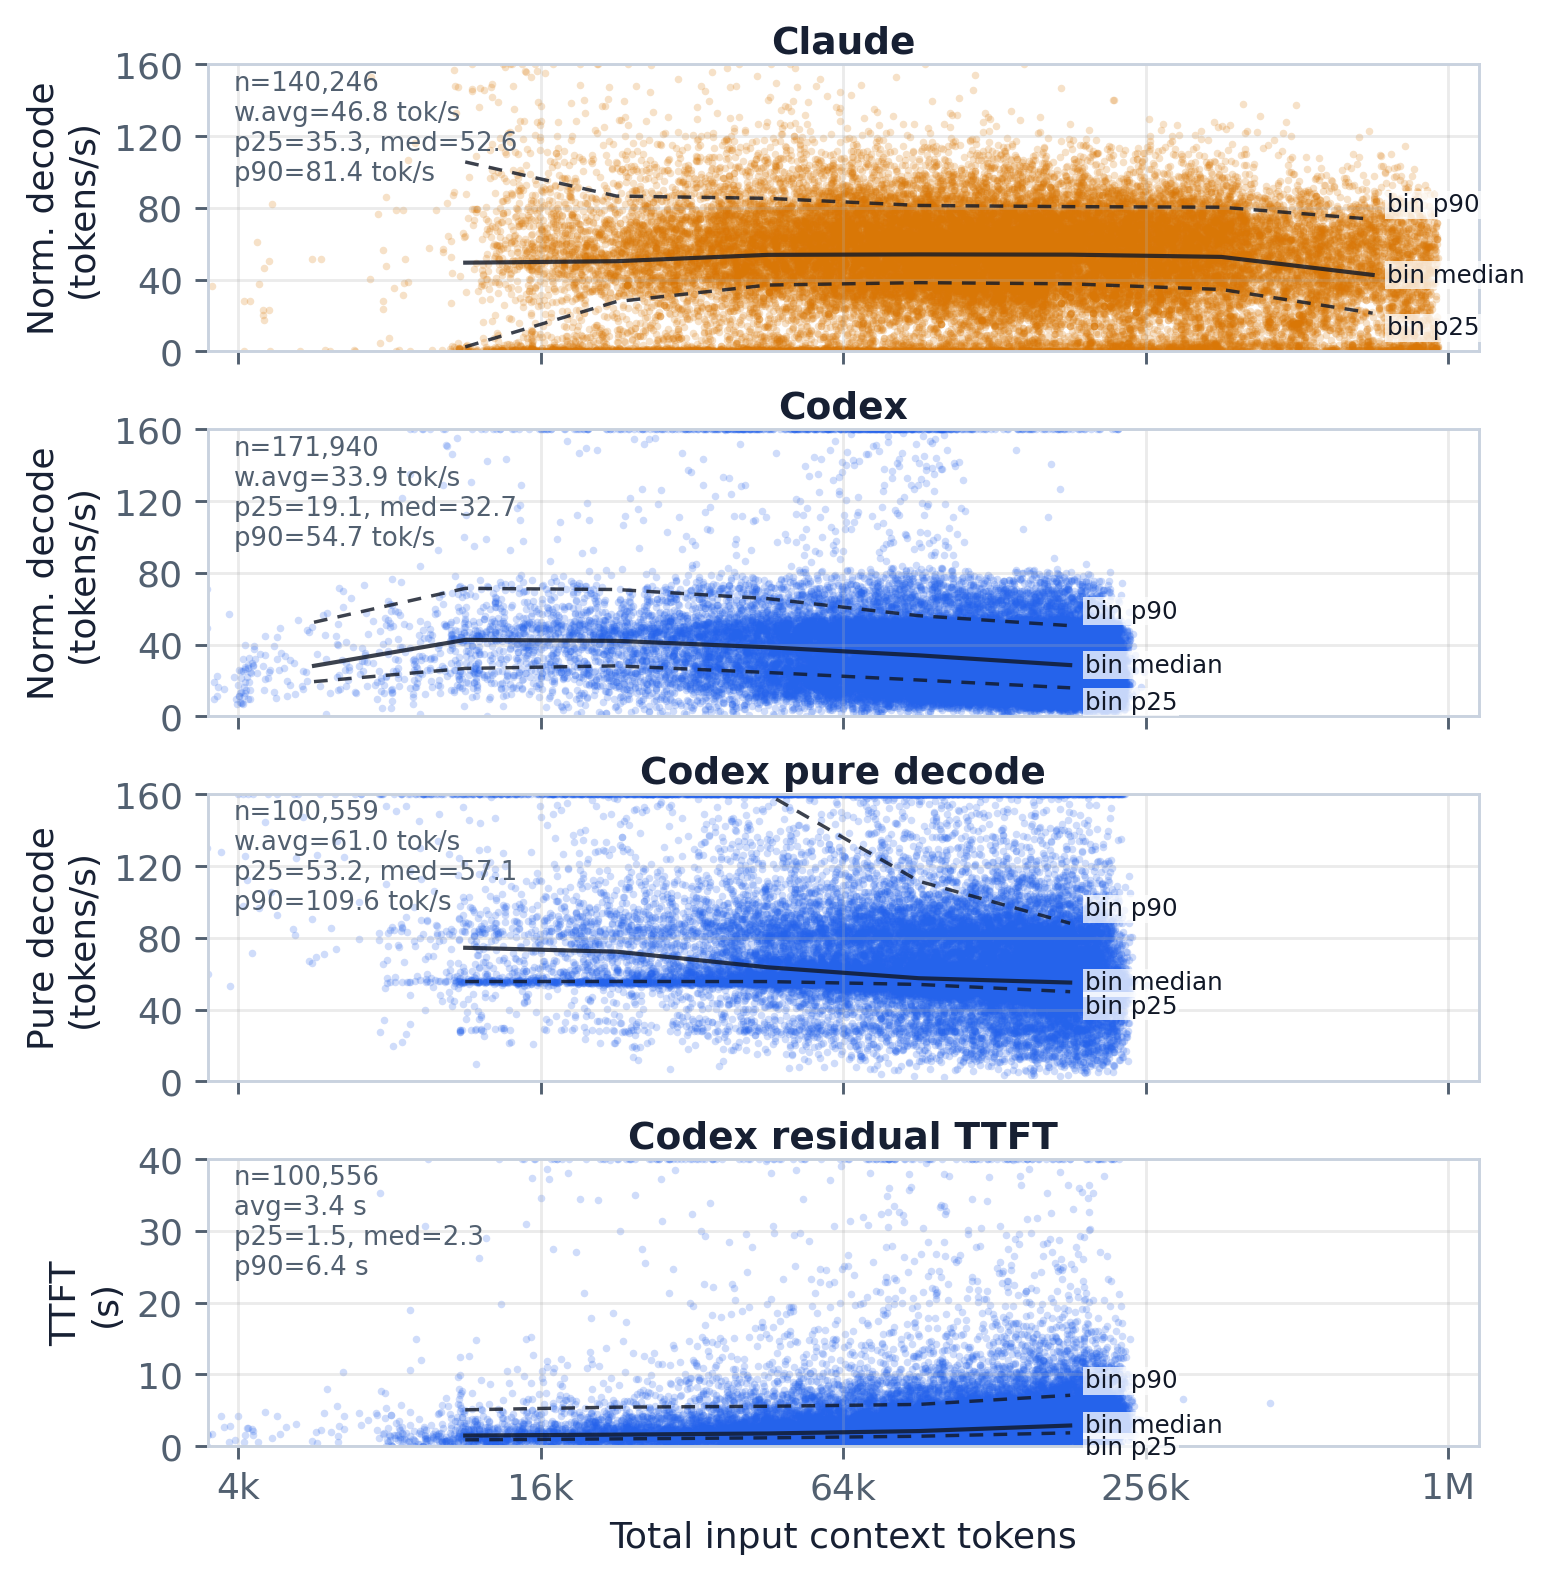
The stacked panels (the paper’s fig:context_decode_speed) plot trace-observed timing against total
input context, with binned p25/median/p90 trends over the per-step cloud. The headline is that longer
context goes with slower generation, but the per-step spread is wide at every context length. Claude’s
binned median normalized decode speed holds near 50–54 tokens/s through most of its range and only
sags at the longest contexts, down to about 43 tokens/s around 740k input tokens. Codex shows a
clearer slope: its binned median falls from ~43 tokens/s at 12k–23k input tokens to ~29 tokens/s near
185k. The Codex-only panels isolate the components — median pure decode speed drops from ~74 tokens/s
at 12k to ~55 tokens/s near 185k, while median residual TTFT climbs from ~1.5s to ~2.9s over the same
range. So context length alone does not explain the variance; scheduling, model version, output shape,
and backend state evidently contribute too.
Each point is one agent step with positive output tokens, positive total input tokens, and a
positive observable generation span. The context length is input_tokens_total, falling back to
prefix_tokens + newly_append_tokens if the total is missing.
Normalized decode speed is:
output_tokens / observable_generation_span_seconds
where the observable span is the latest input event (user_message or tool_result) at or before
the first model-output event through the last model-output event (reasoning, text, or
tool_call). This matches the definition used by the paper macros for median normalized decode
speed. It is trace-observed time, not a serving-engine internal decode timer.
For Codex, the figure also reports two exact-reasoning-token estimates, restricted to steps with at
least 0.1 seconds of post-reasoning span. Pure decode speed is visible or structured output tokens
(output_tokens - reasoning_output_tokens) divided by the span from the reasoning marker/end to the
last non-reasoning model-output event (text or tool_call). Residual TTFT is:
input_to_reasoning_end_seconds - reasoning_output_tokens * aggregate_post_reasoning_decode_latency
where aggregate_post_reasoning_decode_latency is the token-weighted Codex post-reasoning decode
latency computed over all eligible exact-reasoning Codex steps. These definitions match the paper
macro definitions for Codex post-reasoning decode speed and residual TTFT. The w.avg labels shown
on speed panels are token-weighted average throughputs (sum(tokens) / sum(seconds)), avoiding the
outlier sensitivity of the arithmetic mean of per-step ratios.
The scatter samples points deterministically for readability, but summary and bin-quantile CSVs use
all eligible steps. Y-axes are capped by --max-speed-tokens-per-second (default: 160 tok/s),
--max-pure-decode-tokens-per-second (default: 160 tok/s), and --max-ttft-seconds (default:
40 s). Values outside the plotted range are drawn at the axis boundary. The plotted x-axis starts at
--min-context-tokens (default: 4096 tokens). Codex pure-decode and residual-TTFT panels require
post_reasoning_output_seconds >= --min-codex-post-reasoning-seconds (default: 0.1).
uv run python artifacts/llm_generation/context_decode_speed_scatter/plot.py \
  --db trace/syfi_coding_trace.duckdb \
  --min-codex-post-reasoning-seconds 0.1
context_decode_speed_scatter.png / .pdf — stacked scatter panels with binned p25/median/p90
trends.context_decode_speed_summary.csv — per-provider context and normalized-speed percentiles.context_decode_speed_variance.csv — per-provider raw and display-capped normalized-speed
variance/stddev.context_decode_speed_bins.csv — per-provider speed quantiles by binary context-length bin.context_decode_speed_codex_timing_summary.csv — Codex pure decode and TTFT percentiles.context_decode_speed_codex_timing_bins.csv — Codex pure decode and TTFT quantiles by binary
context-length bin.