
What do the full distributions of cached prefix, adjusted append, and output tokens look like side by side, drawn as transparent “spindle” (violin-like) shapes on one shared token axis?
What do the full distributions of cached prefix, adjusted append, and output tokens look like side by side, drawn as transparent “spindle” (violin-like) shapes on one shared token axis?
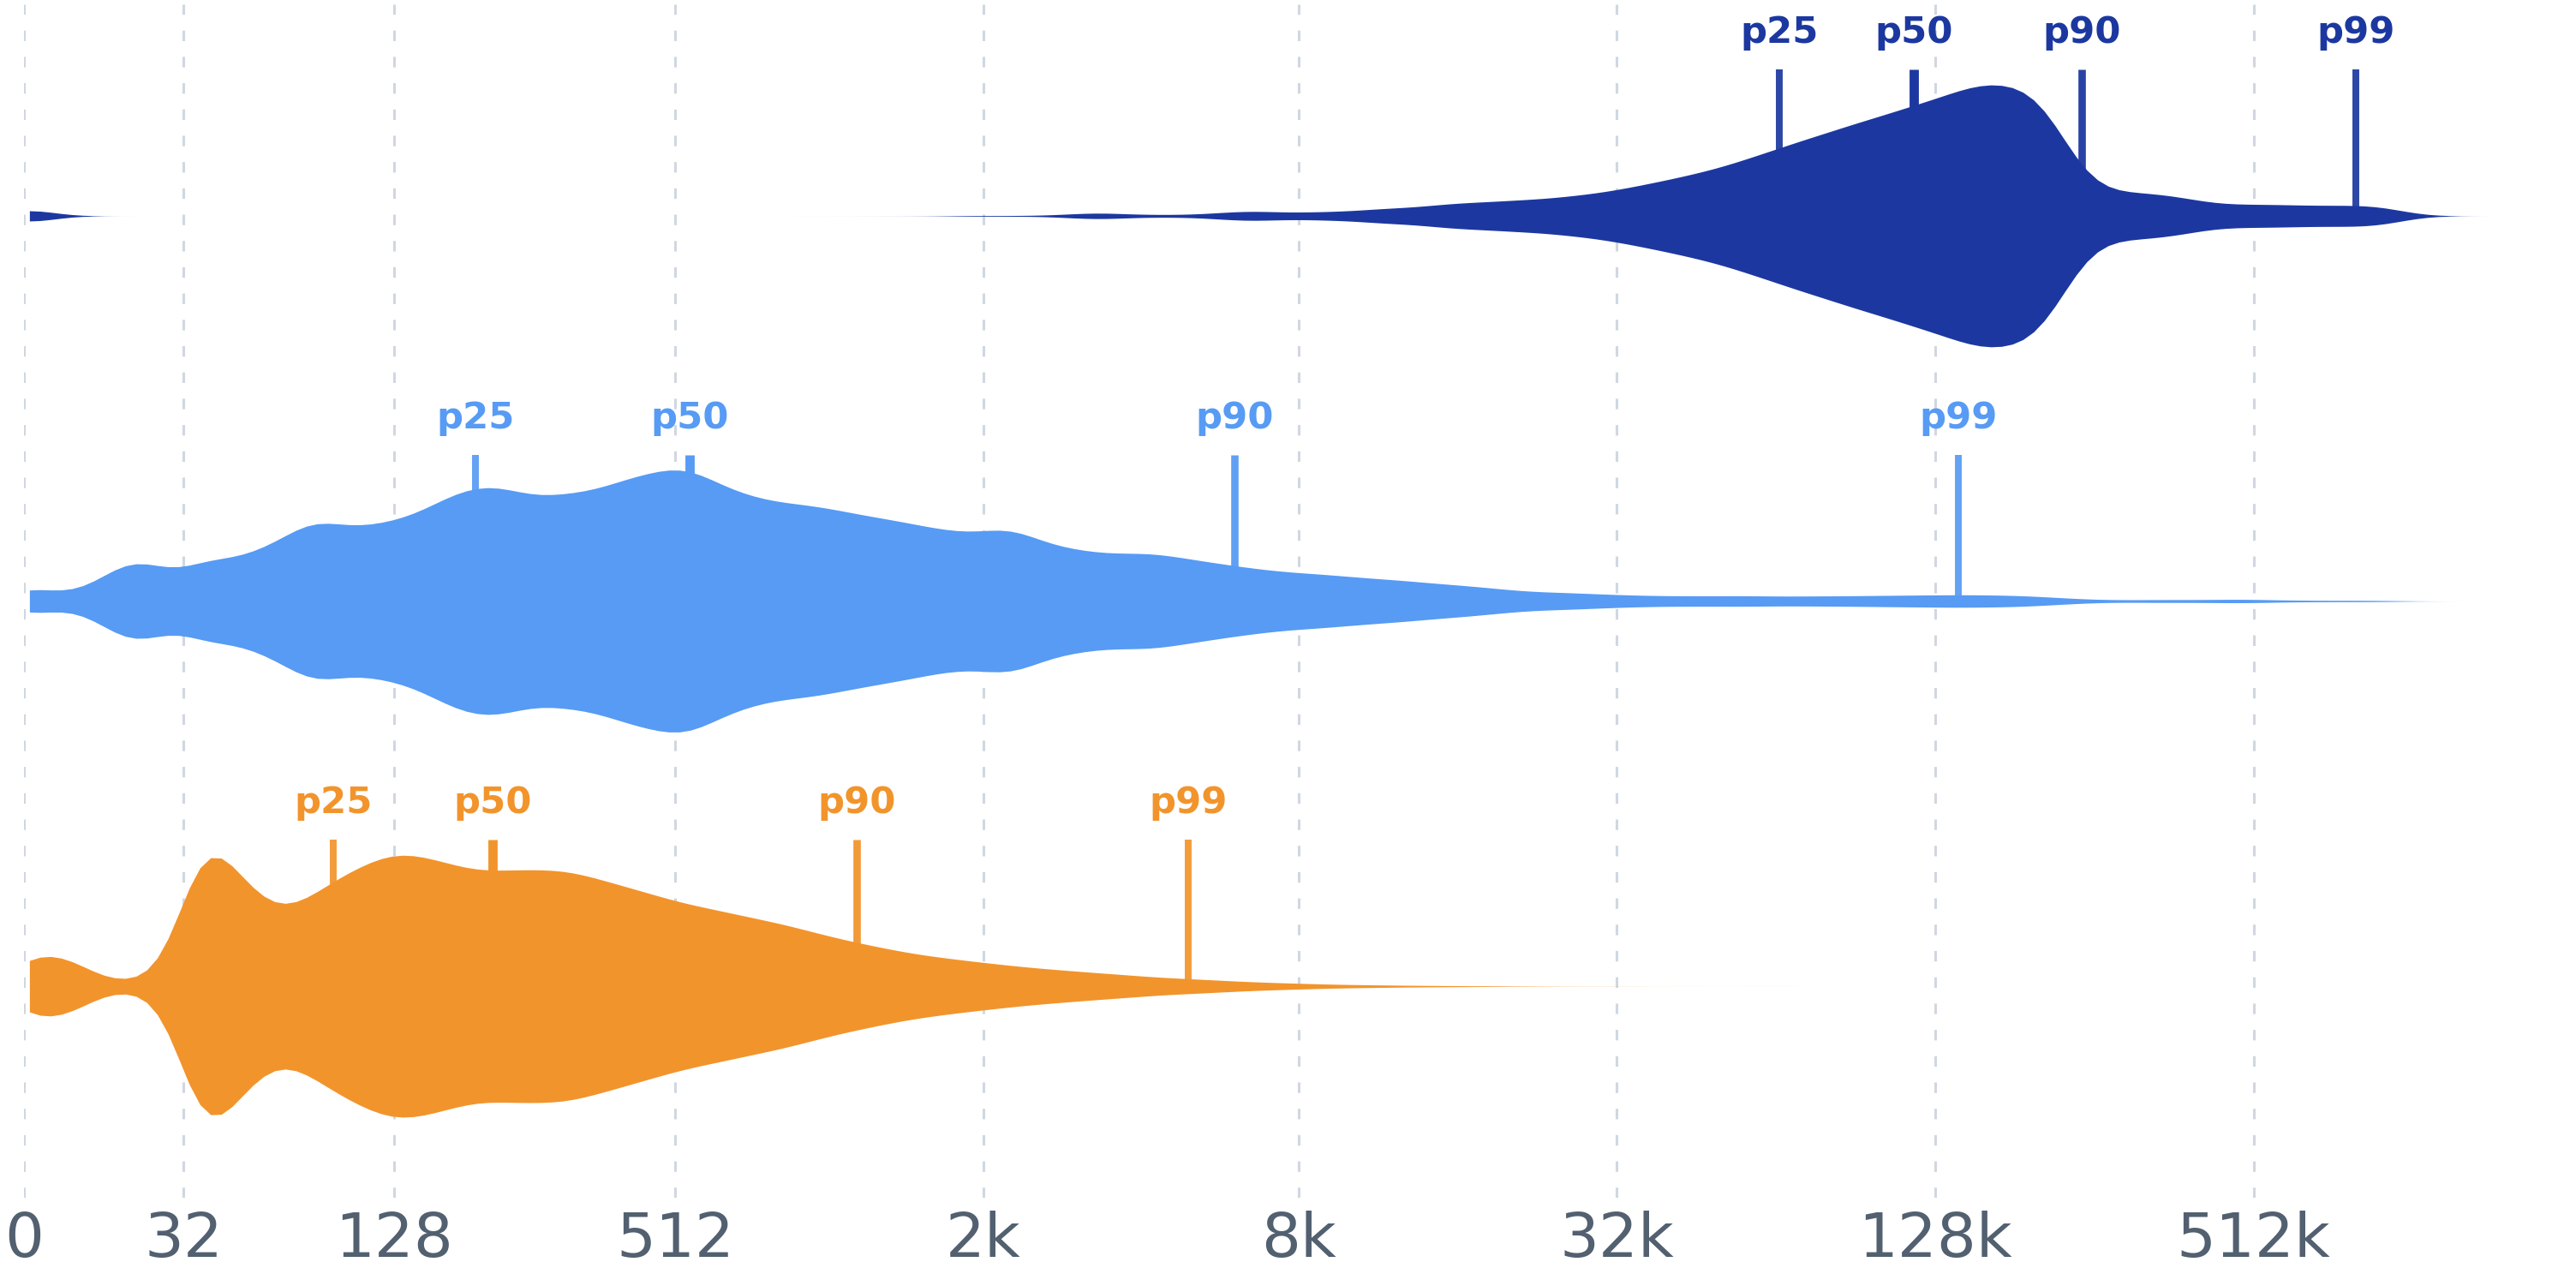
Each row in the trace is one agent step. This experiment collapses three per-step token quantities into three stacked spindles on a single compressed token axis, so their typical sizes and tails can be compared at a glance.
Method and assumptions:
prefix_tokens (the cached / cache-read portion of the input).newly_append_tokens − prior-step output, applied only when the previous
step is Claude or Codex gpt-5.5 (the providers whose previous output is echoed back into the
next input). The Codex output proxy used for the subtraction is visible output
(output_tokens − reasoning_output_tokens); the result is clamped at 0. Pairs are formed only
between adjacent steps in the same session (round_index differs by exactly 1).output_tokens of every parsed invocation row — it is not paired or
adjusted, so its spindle covers all steps, not just the adjacency-paired ones.session_id, and ordered within a session by round_index with the ingestion ordinal as the
tie-break (ORDER BY round_index, ingest_seq) — reproducing the old stable sort over the
line-ordered JSONL. The spindle statistics (histogram density, quantiles, min/max) are
order-independent, so the per-CSV output is byte-identical regardless of session iteration order.log2(tokens + 32) − log2(32), so the dense 0–32
token region is not visually over-expanded. Percentiles use linear interpolation over the full
data (no sampling).This is a hybrid experiment: the trace DuckDB does the single-pass ingest, and Python keeps the pairing heuristic, the spindle density/quantile math, and the plotting.
load_pairs(con) — one query pulls the step scalars
(session_id, provider, model, round_index, prefix_tokens, newly_append_tokens, output_tokens, reasoning_output_tokens) in session/step order; Python groups by session, forms adjacent pairs,
applies the subtraction policy (should_subtract_previous_output, output_proxy), and collects
the unpaired output-token series. This is the only data-loading code; everything below is
unchanged from the pre-DuckDB version.percentile(...) / summary_row(...) — exact linear-interpolation quantiles and the per-metric
summary record.token_axis_x(...) / token_ticks(...) / smooth_density(...) — the compressed token axis and
the Gaussian-smoothed histogram that gives each spindle its shape.plot_combined_spindles(...) — the three stacked transparent spindles with p25/p50/p90/p99
markers; write_summary(...) — the per-metric quantile CSV.The data layer lives in artifacts/utils/trace_db.py (see artifacts/utils/DB_SCHEMA.md).
# default merged trace (materialized to a temp DuckDB cache on first use)
uv run python artifacts/llm_generation/token_spindles/plot.py

# a specific trace
uv run python artifacts/llm_generation/token_spindles/plot.py -i trace/sample.jsonl

# a prebuilt DB (run_all.py's build-db step passes this), into a chosen dir
uv run python artifacts/llm_generation/token_spindles/plot.py --db "$TMPDIR/trace.duckdb" -o "$TMPDIR/out"
--db | -i/--input | -o/--output-dir are the standard I/O flags; -o defaults to this folder.
token_spindles_transparent.png — the combined transparent spindle figure.token_spindle_summary.csv — per-metric counts (positive / zero) and quantiles
(p25, median, p90, p95, p99, min, max).result_analysis.md — generated run log (policy note, axis note, pairing stats).Each PNG embeds this README, the summary CSV, and plot.py. Unpack with
uv run python artifacts/utils/png_sidecar.py extract <png>.