
Which tools do coding agents actually call, how often, and how often do those calls fail — separately for Claude Code and Codex?
Which tools do coding agents actually call, how often, and how often do those calls fail — separately for Claude Code and Codex?
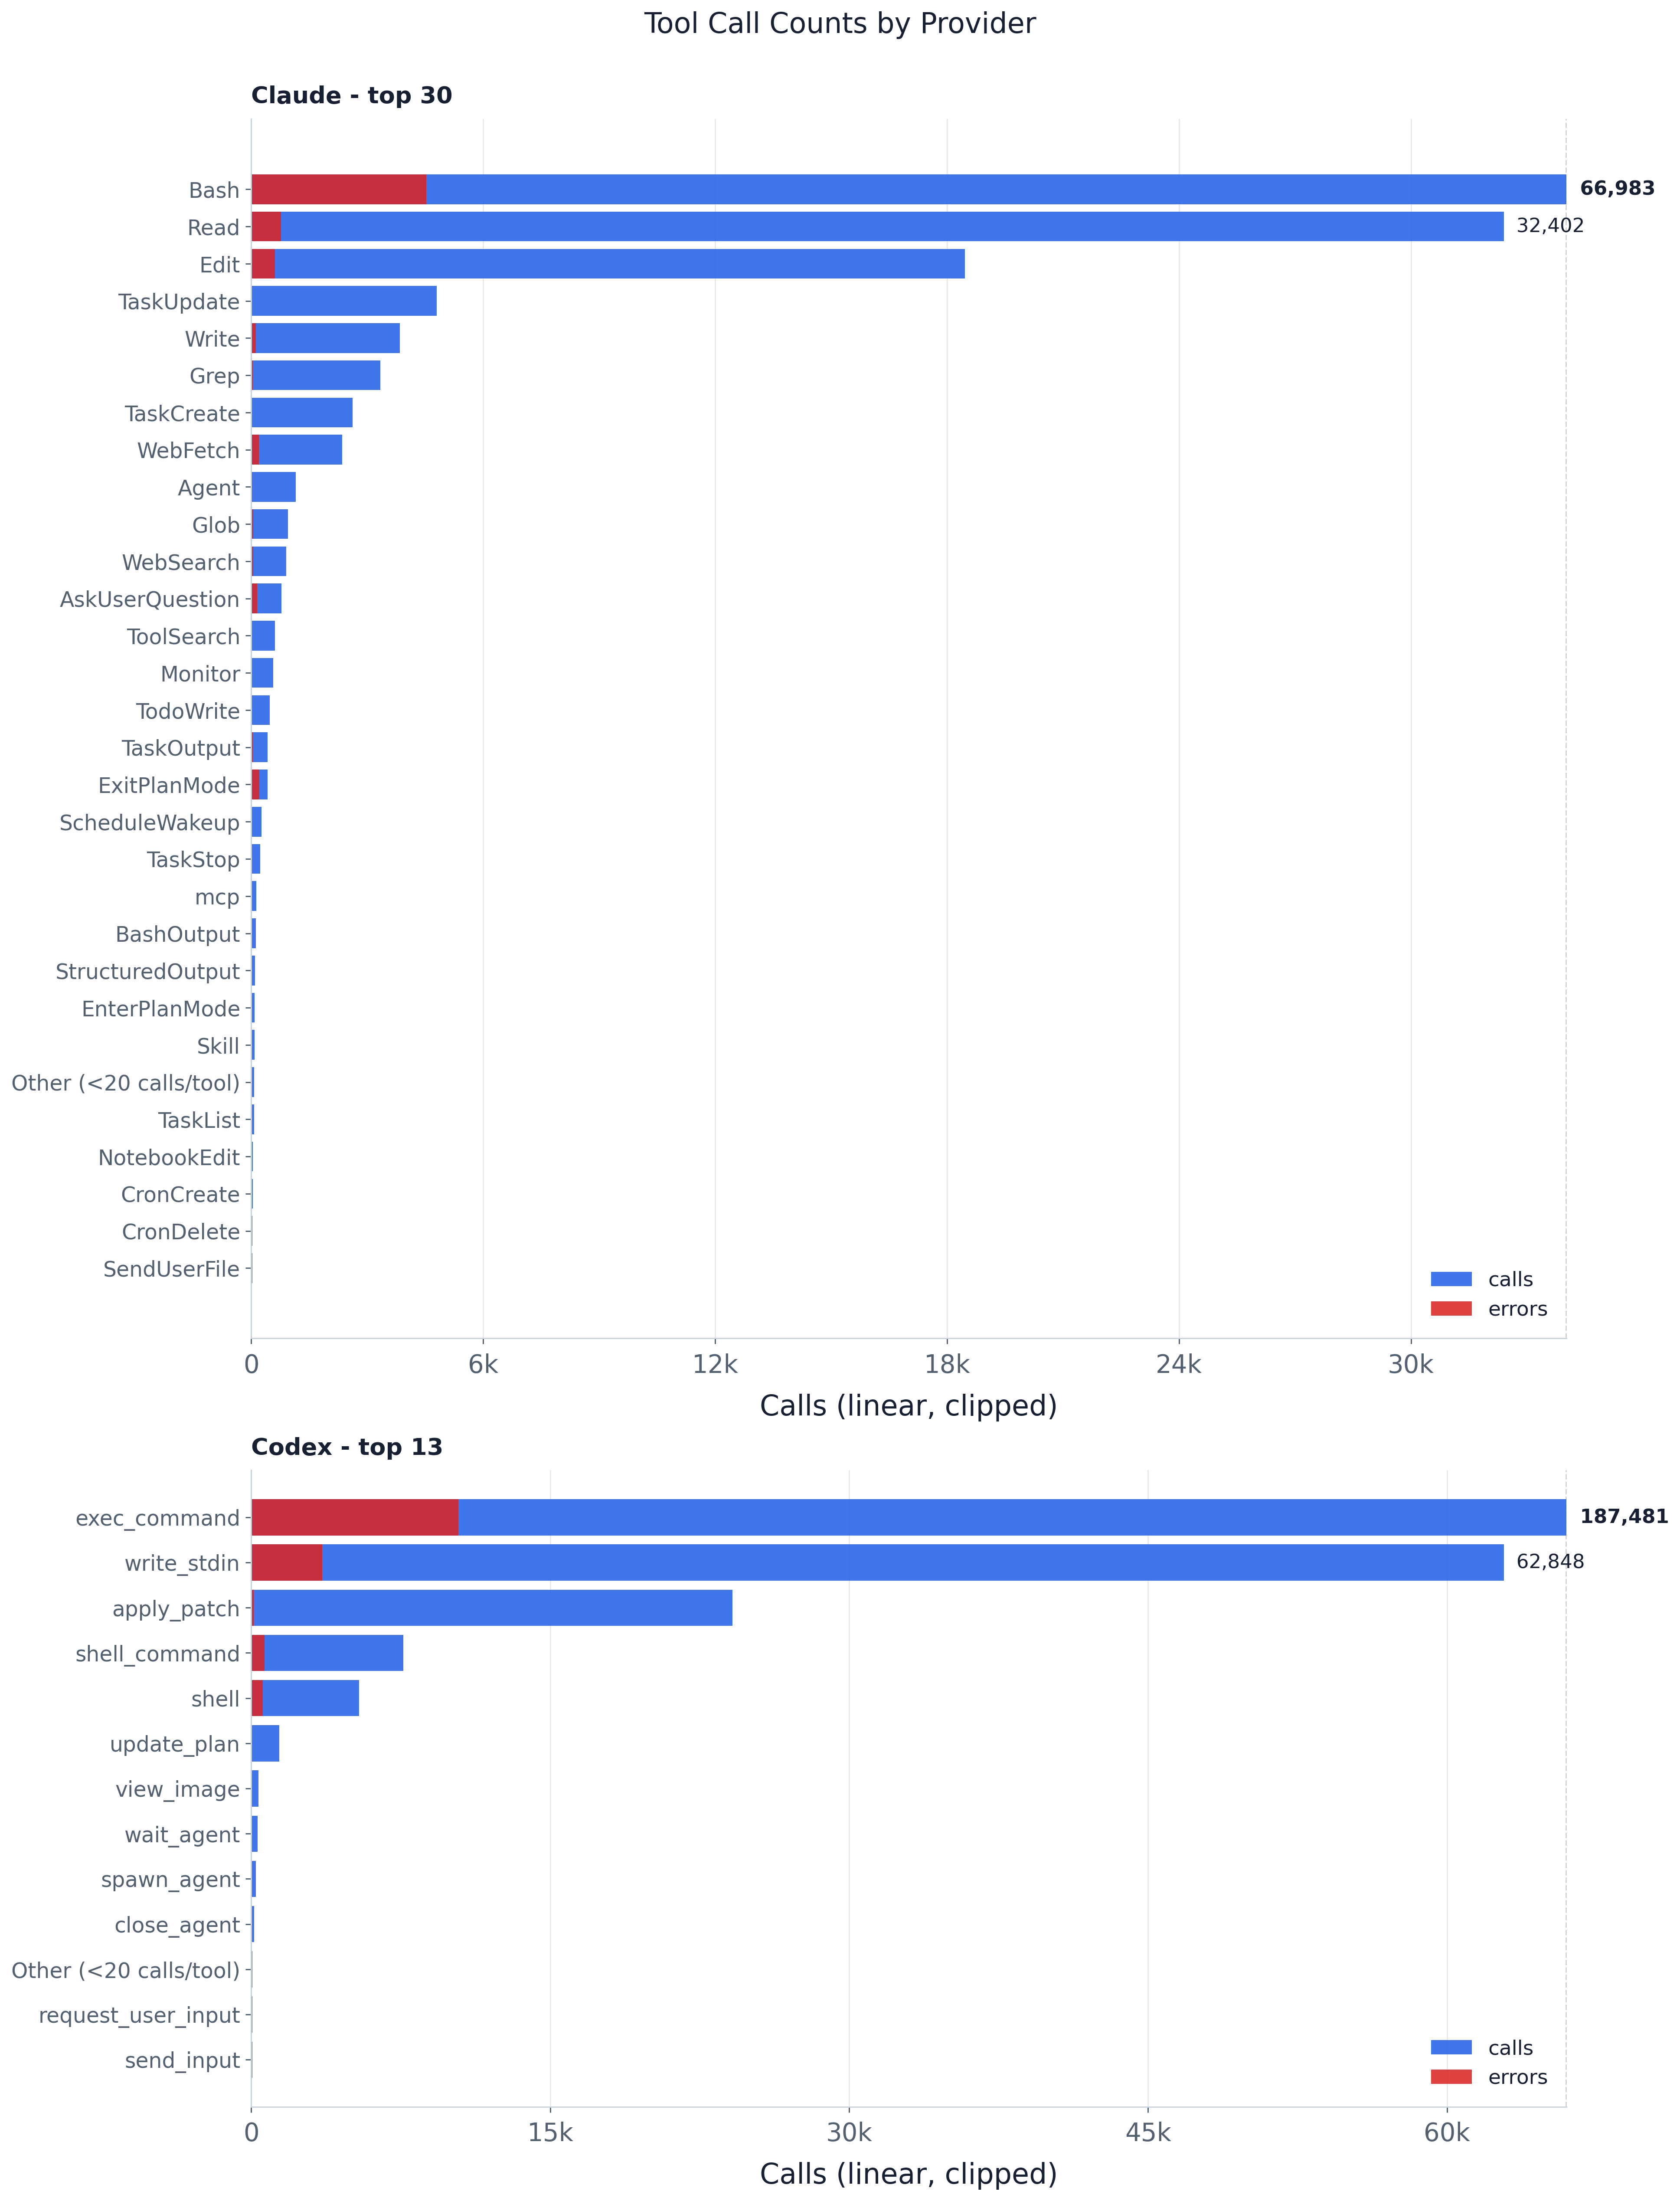
Tool usage is steeply concentrated: command execution leads both providers, trailed by file
operations like Read and Edit (the paper’s fig:tool_call_counts). Claude leans on Bash
(the clipped leader, annotated with its true 159k calls), then Read (64k) and Edit (37k);
Codex leans on exec_command (252k), then write_stdin (76k) and exec (47k). The
concentration is extreme: the top three account for 85.0% of Claude’s calls and 85.3% of Codex’s.
Everything past the head is a thin
long tail of specialized and MCP tools, collapsed into the Other bar. The red error overlay
flags reliability outliers — Claude’s ExitPlanMode and AskUserQuestion fail far more often
than the high-volume primitives — with exact per-tool error_rate in the CSV.
Every agent step in the trace carries a tools[] list of the tool calls the model made in that step.
This experiment counts those calls per (provider, tool) and renders one horizontal-bar panel
per provider, tools ordered by call volume, with a red overlay marking the share that returned an
error.
Method and assumptions:
tool_calls (the UNNESTed tools[]), not agent steps —
a step that calls Bash three times contributes three.mcp_ is aliased to a single mcp
bucket, since the long opaque server-qualified names are individually rare and uninformative in
aggregate.--min-tool-calls-for-plot provider-local calls (default 20) are summed into one
Other (<N calls/tool) bar. The CSV keeps full per-tool detail — nothing is dropped from the
data, only from the plot.is_error is true, drawn as a shorter bar inside the call
bar.plot.py is a thin query→shape→plot pipeline over the shared trace DuckDB:
load_tool_counts_by_provider(con, *, min_calls) — one GROUP BY provider, tool_name query
(with the mcp_* → mcp alias done in SQL), then the rare-tool collapse in Python (summing is
order-independent). Returns {provider: {tool_name: ToolCounts(calls, error_calls)}}.plot_tool_counts(...) — builds the per-provider panels and the clipped-axis figure.tool_count_panel_cap(...) — the shared clip/annotation rule, used by both the plot and the CSV
so the table’s panel_cap / *_plot_width columns match the rendered bars exactly.write_tool_call_counts_by_provider(...) — the full-detail CSV.main() — wires the standard trace_db CLI (--db | -i/--input | -o/--output-dir) to the
above and embeds the self-contained PNG sidecar.The data layer (parsing, surrogate keys, schema) lives in artifacts/utils/trace_db.py; see
artifacts/utils/DB_SCHEMA.md.
# default merged trace, output next to this README
uv run python artifacts/tool_calls/tool_call_counts/plot.py

# a specific trace (materialized to a temp DuckDB cache on first use)
uv run python artifacts/tool_calls/tool_call_counts/plot.py -i trace/sample.jsonl

# a prebuilt DB (run_all.py's build-db step passes this), into a chosen dir
uv run python artifacts/tool_calls/tool_call_counts/plot.py --db "$TMPDIR/trace.duckdb" -o "$TMPDIR/out"
Useful flags: --top-tools (max bars per panel, default 30), --min-tool-calls-for-plot
(rare-tool collapse threshold, default 20).
tool_call_counts.png — provider-paneled tool call counts with error overlay.tool_call_counts_by_provider.csv — full per-tool counts: calls, error_calls, error_rate,
plus the plot-geometry columns (panel_cap, call_plot_width, call_is_clipped, …).The PNG is self-contained — it embeds this README, the CSV, and the plotting code. Unpack with
uv run python artifacts/utils/png_sidecar.py extract <png>.