
Do low prefix-cache-hit agent steps follow long idle waits or long tool durations — i.e. is a cache miss explained by the cache having been evicted during the preceding gap?
Do low prefix-cache-hit agent steps follow long idle waits or long tool durations — i.e. is a cache miss explained by the cache having been evicted during the preceding gap?
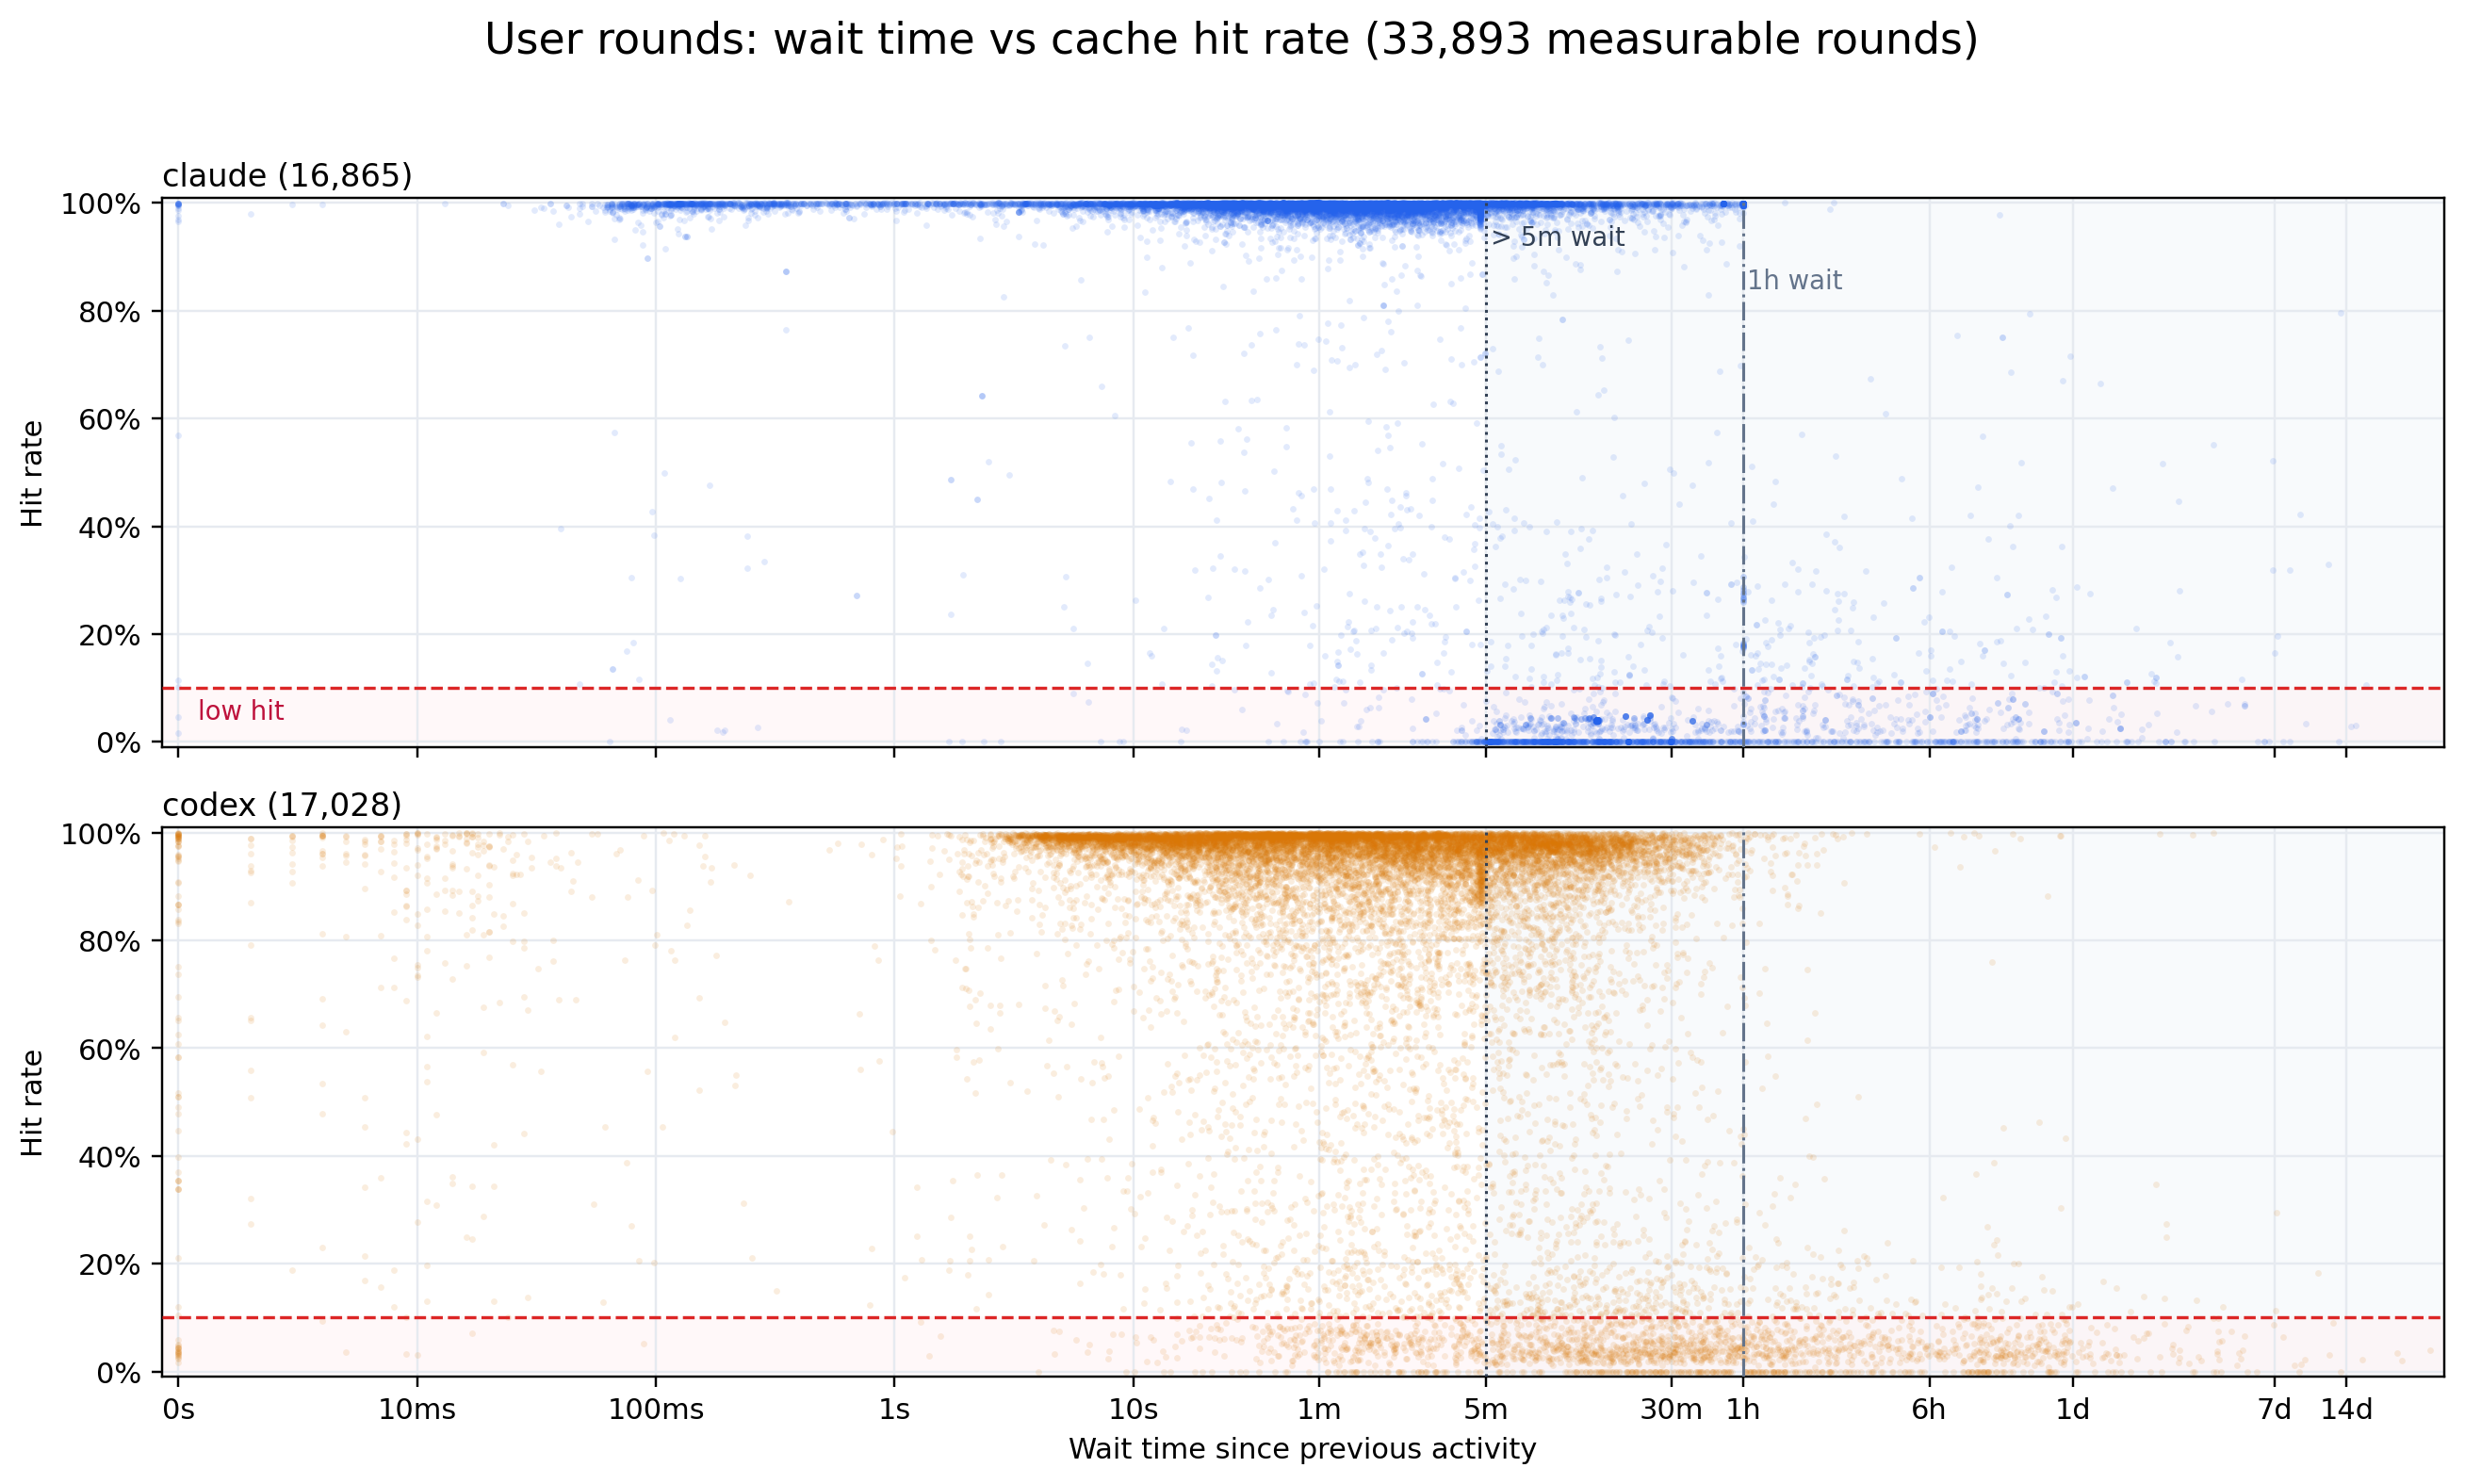
Per-step human idle wait (x, log scale from ~1ms to the data max, ticked at 0s/10ms/…/7d/14d)
against prefix-cache hit rate (y, 0–100%), one panel per provider, with a shaded band beyond 5m,
a red dashed 10% low-hit floor, and vertical guides at 5m and 1h. This is the user-trigger half of
the paper’s fig:prefix_cache_hit_rate_by_idle_time, and it shows the time-based-eviction signature:
the low-hit points cluster at long waits. Below ~5m almost every step still hits, but past that the
low-hit tail thickens, and beyond 1h the cache is effectively gone. The data backs this up — among
user steps whose hit rate dips under 10%, the median preceding wait is ~12.5 min and the p90 is ~7.3 h,
versus a ~2 min median wait for user steps overall. So user misses are idle-driven: the prefix ages
out during the human’s pause and the next request re-appends most of its context.
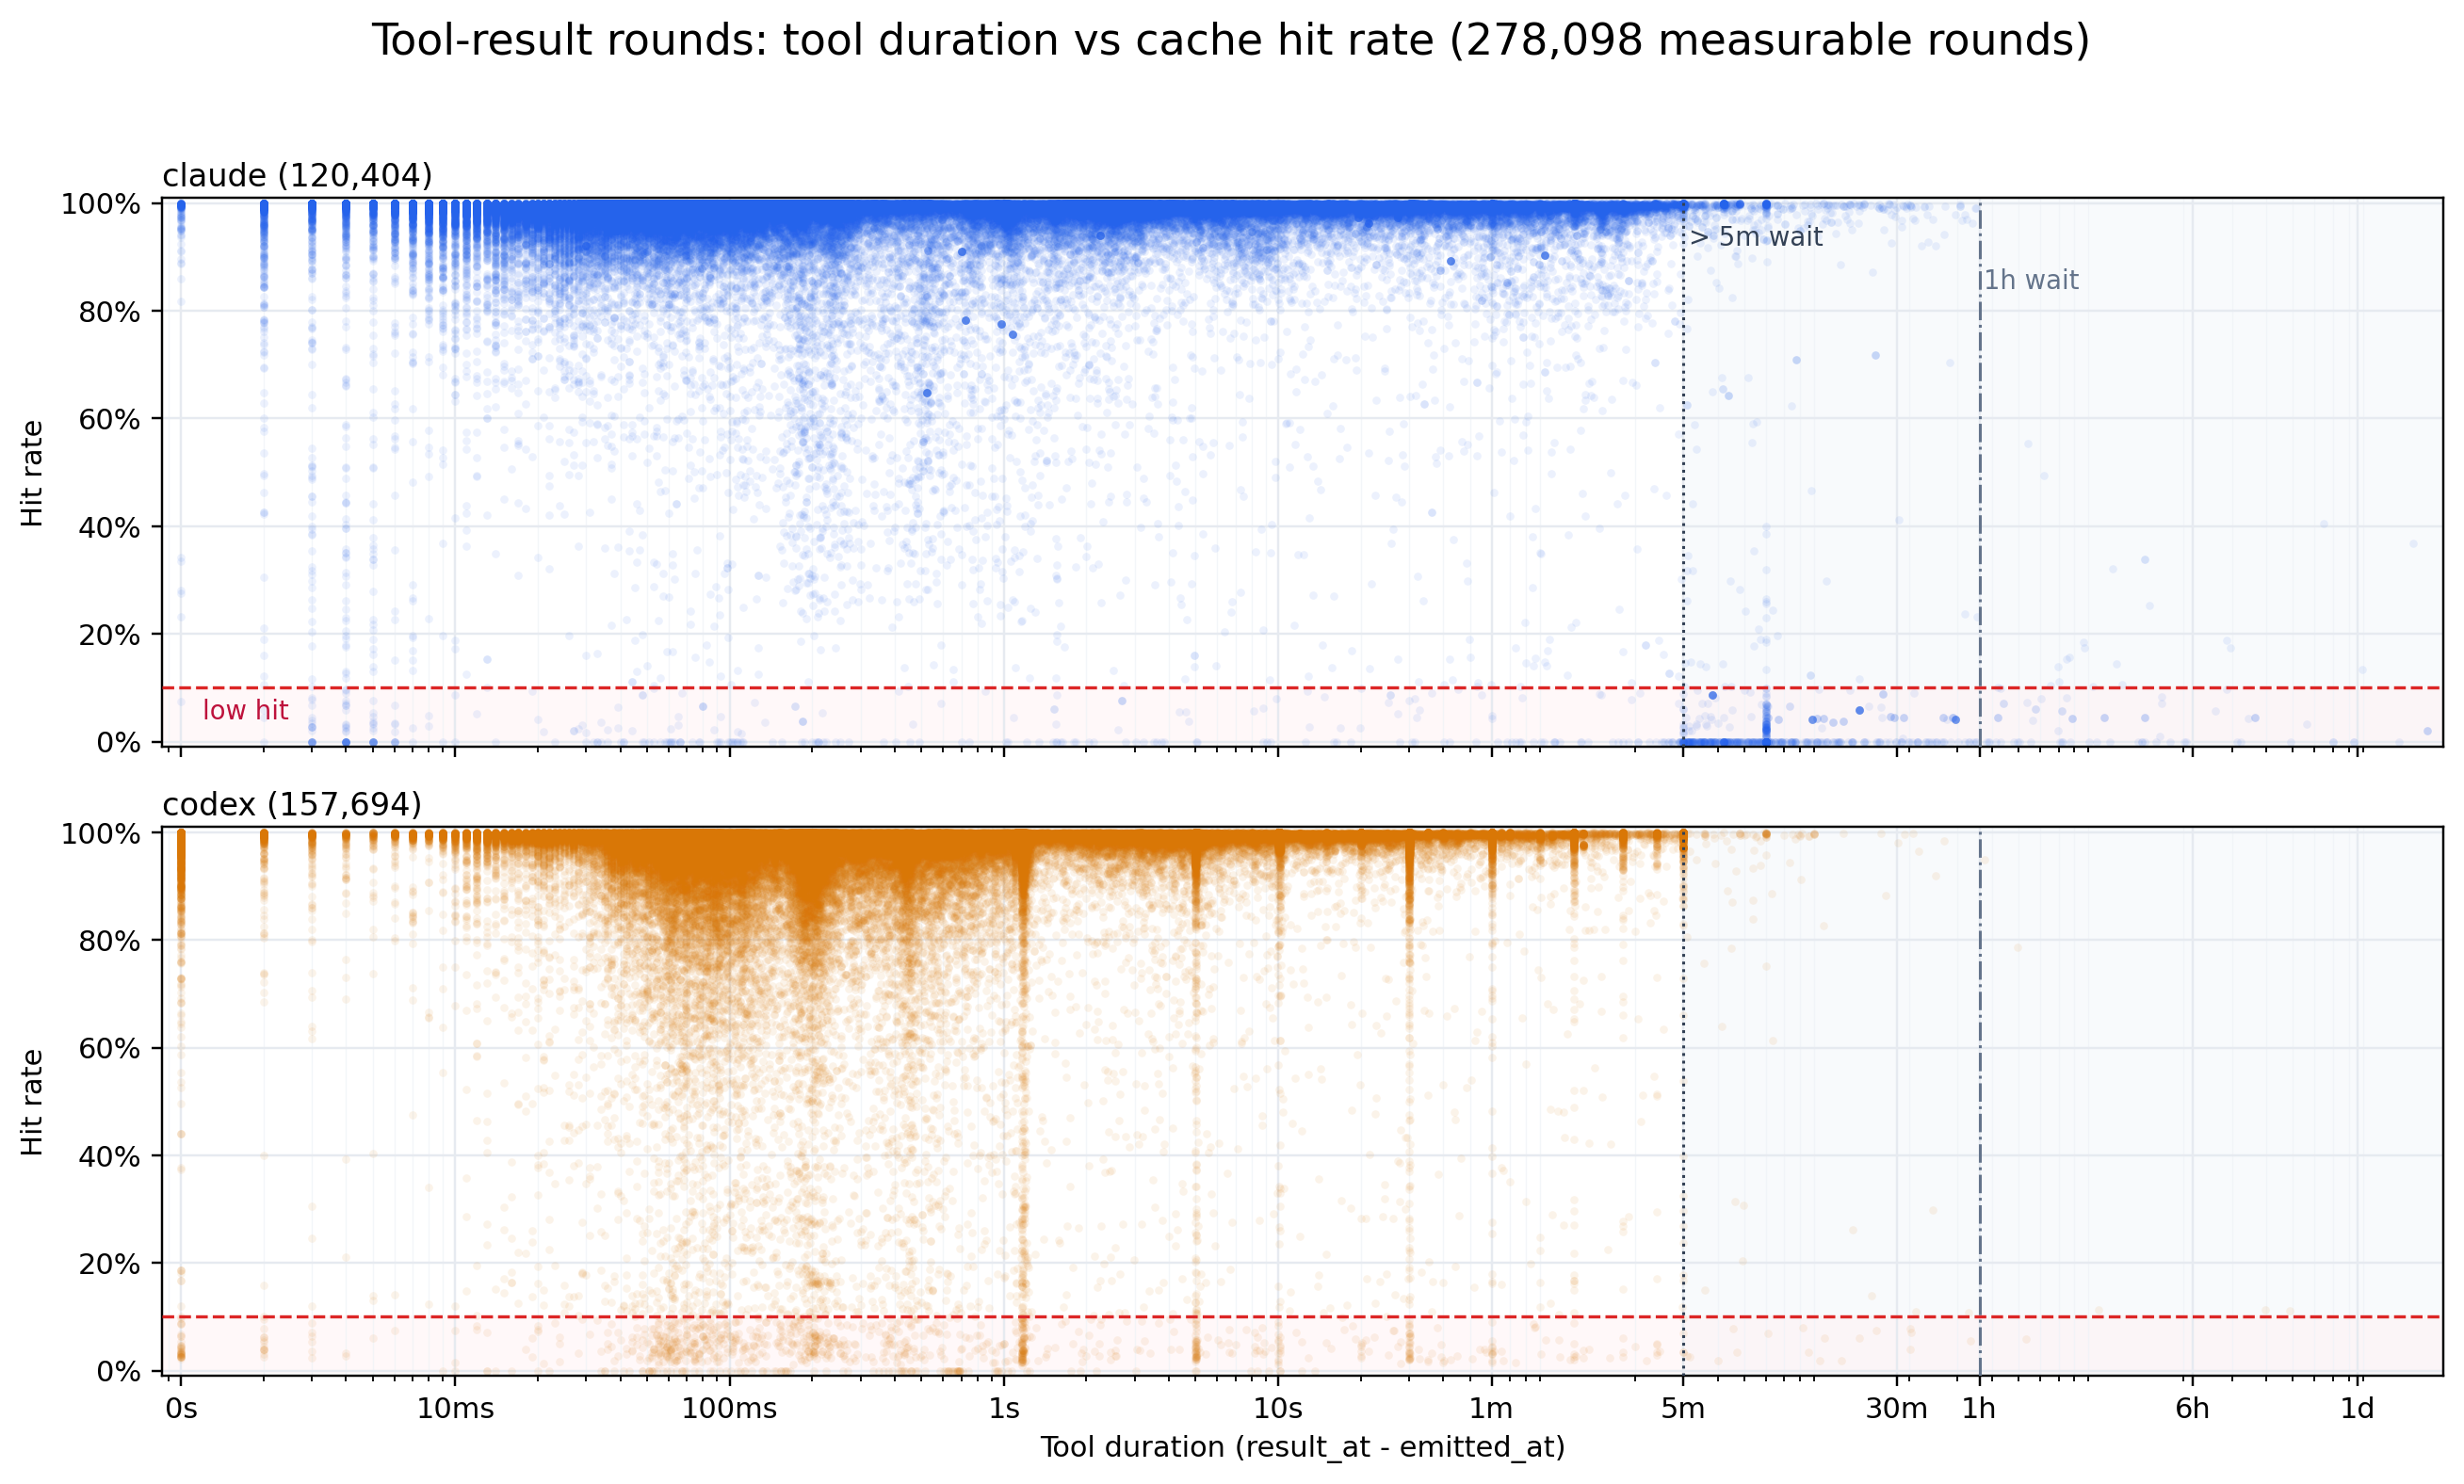
The same layout for tool-triggered steps, with x as the leading tool duration
(result_at - emitted_at) instead of the human wait. Tool gaps are far shorter than human waits, so
the cloud concentrates from sub-second to a few minutes and the >5m band is sparse — especially for
Codex, which pushes long-running work into the background so its tool steps resume quickly (median
gap ~0.25s, p90 ~30s). Hit rates stay high across nearly all tool durations: the cache routinely
survives tool-triggered follow-ups because most tools return well inside any plausible eviction
window. The handful of low-hit tool steps that do appear trail toward the longer durations, the same
aging effect as the human-wait panel but rare here. This is why tab:prefix_cache_hit_rate puts
tool-result hit at ~97.5% while user-initiated lags.
Two scripts share this folder, both relating an agent step’s prefix-cache hit ratio to the gap that precedes it:
hit_ratio = prefix_tokens / (prefix_tokens + newly_append_tokens)
A step is classified by the type of its first timing event:
user_message step — the preceding gap is the human idle wait since the previous activity
in the same session;tool_result step — the preceding gap is the tool duration (result_at - emitted_at) of
the leading tool result(s) the step consumes.cache_hit_idle_gap_analysis.py aggregates, per (scope, trigger), how often low-hit steps sit
behind a long gap (the gap/hit summary CSV). plot_user_wait_time_vs_hit_rate.py draws the raw
per-step (gap, hit-rate) cloud as provider-paneled scatters. A negative association — low hit rates
concentrated at long gaps — is consistent with time-based cache eviction.
Method and key assumptions:
prefix_tokens / (prefix_tokens + newly_append_tokens); steps with a
non-positive token total are dropped.event_type of the step’s first timing event (event_index = 1); only
user_message and tool_result steps are measured.user trigger) = first_activity(current) - last_activity(previous step in the session), kept when ≥ 0. first_activity is the first timing event carrying a timestamp
(else the earliest activity timestamp); last_activity is the latest timestamp across the step’s
timing events and its tools’ emitted_at/result_at.tool_result trigger) = the max result_at - emitted_at over the step’s
leading tool-result call ids, looked up in a session-scoped map of tools emitted by previous
steps (tool call ids are unique within a session). Negative durations are discarded.(provider, session_id)
and sorted by (round_index, first_activity_ts). The walk reproduces the pre-DuckDB single-pass
loader exactly — tools are “remembered” only after a step is processed, so a tool_result step
never sees a tool emitted in its own step.merged (all steps), plus each provider (claude, codex). The
scatter draws one panel per provider.CAST(epoch_us(timestamp) AS BIGINT), likewise for tool emitted_at/result_at) and differenced
in Python, never fetched as a raw TIMESTAMP (native duckdb marshals that to a datetime,
duckdb-wasm to a string). A difference of two same-timezone instants equals the naive-microsecond
difference exactly, so every gap matches the pre-DuckDB result bit-for-bit.Both scripts query the shared trace DuckDB (rounds / tool_calls / timing_events) instead of
re-parsing the JSONL. The stateful session walk is shared:
cache_hit_idle_gap_analysis.py
load_rounds_by_session(con) — {(provider, session_id): [RoundData, …]}. One SQL pass each
over timing_events (ordered by round_pk, event_index) and tool_calls (ordered by
round_pk, tool_index) plus the rounds scalars (ordered by round_pk), assembled per step
into a RoundData (trigger event type, first/last activity microseconds, leading tool-result
call ids, and the per-step tool durations keyed by call id). Sessions are sorted by
(round_index, first_activity_ts), reproducing the old line-order tie-break.analyze(con, …) — the stateful walk that, per (scope, trigger), accumulates a GapGroup
(round/low-hit/over-idle counts and the gap lists) via update_group.percentile / format_pct / format_float / write_summary — the summary math and CSV writer,
unchanged from the pre-migration script.plot_user_wait_time_vs_hit_rate.py
collect_points(con, trigger=…) — reuses idle.load_rounds_by_session and runs the same walk to
emit {provider: ([wait_seconds…], [hit_rate…])} for one trigger.plot(...) / count_points(...) / default_output_path(...) / WAIT_TICKS / format_wait_time
— the figure layout (log-x wait axis, per-provider panels, low-hit/long-wait guides) unchanged.main() — wires the standard trace_db CLI and embeds the self-contained PNG sidecar (this
README, the gap CSV, and both scripts).Both use the standard trace_db.add_db_args surface (--db | -i/--input | -o/--output-dir); the
plot script adds --trigger {all,user,tool_result} and a --output single-PNG path (valid only with
one concrete trigger). The data layer (parsing, surrogate keys, schema) lives in
artifacts/utils/trace_db.py; see artifacts/utils/DB_SCHEMA.md.
# default merged trace, outputs next to this README
uv run python artifacts/prefix_cache/cache_hit_idle_relationship/cache_hit_idle_gap_analysis.py
uv run python artifacts/prefix_cache/cache_hit_idle_relationship/plot_user_wait_time_vs_hit_rate.py

# a specific trace (materialized to a temp DuckDB cache on first use)
uv run python artifacts/prefix_cache/cache_hit_idle_relationship/cache_hit_idle_gap_analysis.py -i trace/sample.jsonl

# a prebuilt DB (run_all.py's build-db step passes this), into a chosen dir
uv run python artifacts/prefix_cache/cache_hit_idle_relationship/plot_user_wait_time_vs_hit_rate.py --db "$TMPDIR/trace.duckdb" -o "$TMPDIR/out"

# a single scatter
uv run python artifacts/prefix_cache/cache_hit_idle_relationship/plot_user_wait_time_vs_hit_rate.py --trigger user
Written to -o (default this folder):
cache_hit_idle_gap_summary.csv — one row per (scope, trigger) for
scope ∈ {merged, claude, codex} and trigger ∈ {all, user, tool_result}, with the thresholds
(low_hit_threshold, idle_threshold_seconds), the round/low-hit counts, the over-idle shares
(low_gt_idle_share, all_gt_idle_share, nonlow_gt_idle_share), and gap percentiles
(low_gap_median_s/low_gap_p90_s, all_gap_median_s/all_gap_p90_s).user_wait_time_vs_hit_rate_scatter.png — user-message wait vs hit rate, Claude/Codex panels.tool_result_wait_time_vs_hit_rate_scatter.png — tool duration vs hit rate, Claude/Codex panels.Each scatter PNG is self-contained — it embeds this README, the gap-summary CSV, and both scripts.
Unpack with uv run python artifacts/utils/png_sidecar.py extract <png>.