
What fraction of each agent step’s input is served from the cached prefix, and how does that prefix hit ratio distribute across user-initiated and tool-triggered steps?
What fraction of each agent step’s input is served from the cached prefix, and how does that prefix hit ratio distribute across user-initiated and tool-triggered steps?
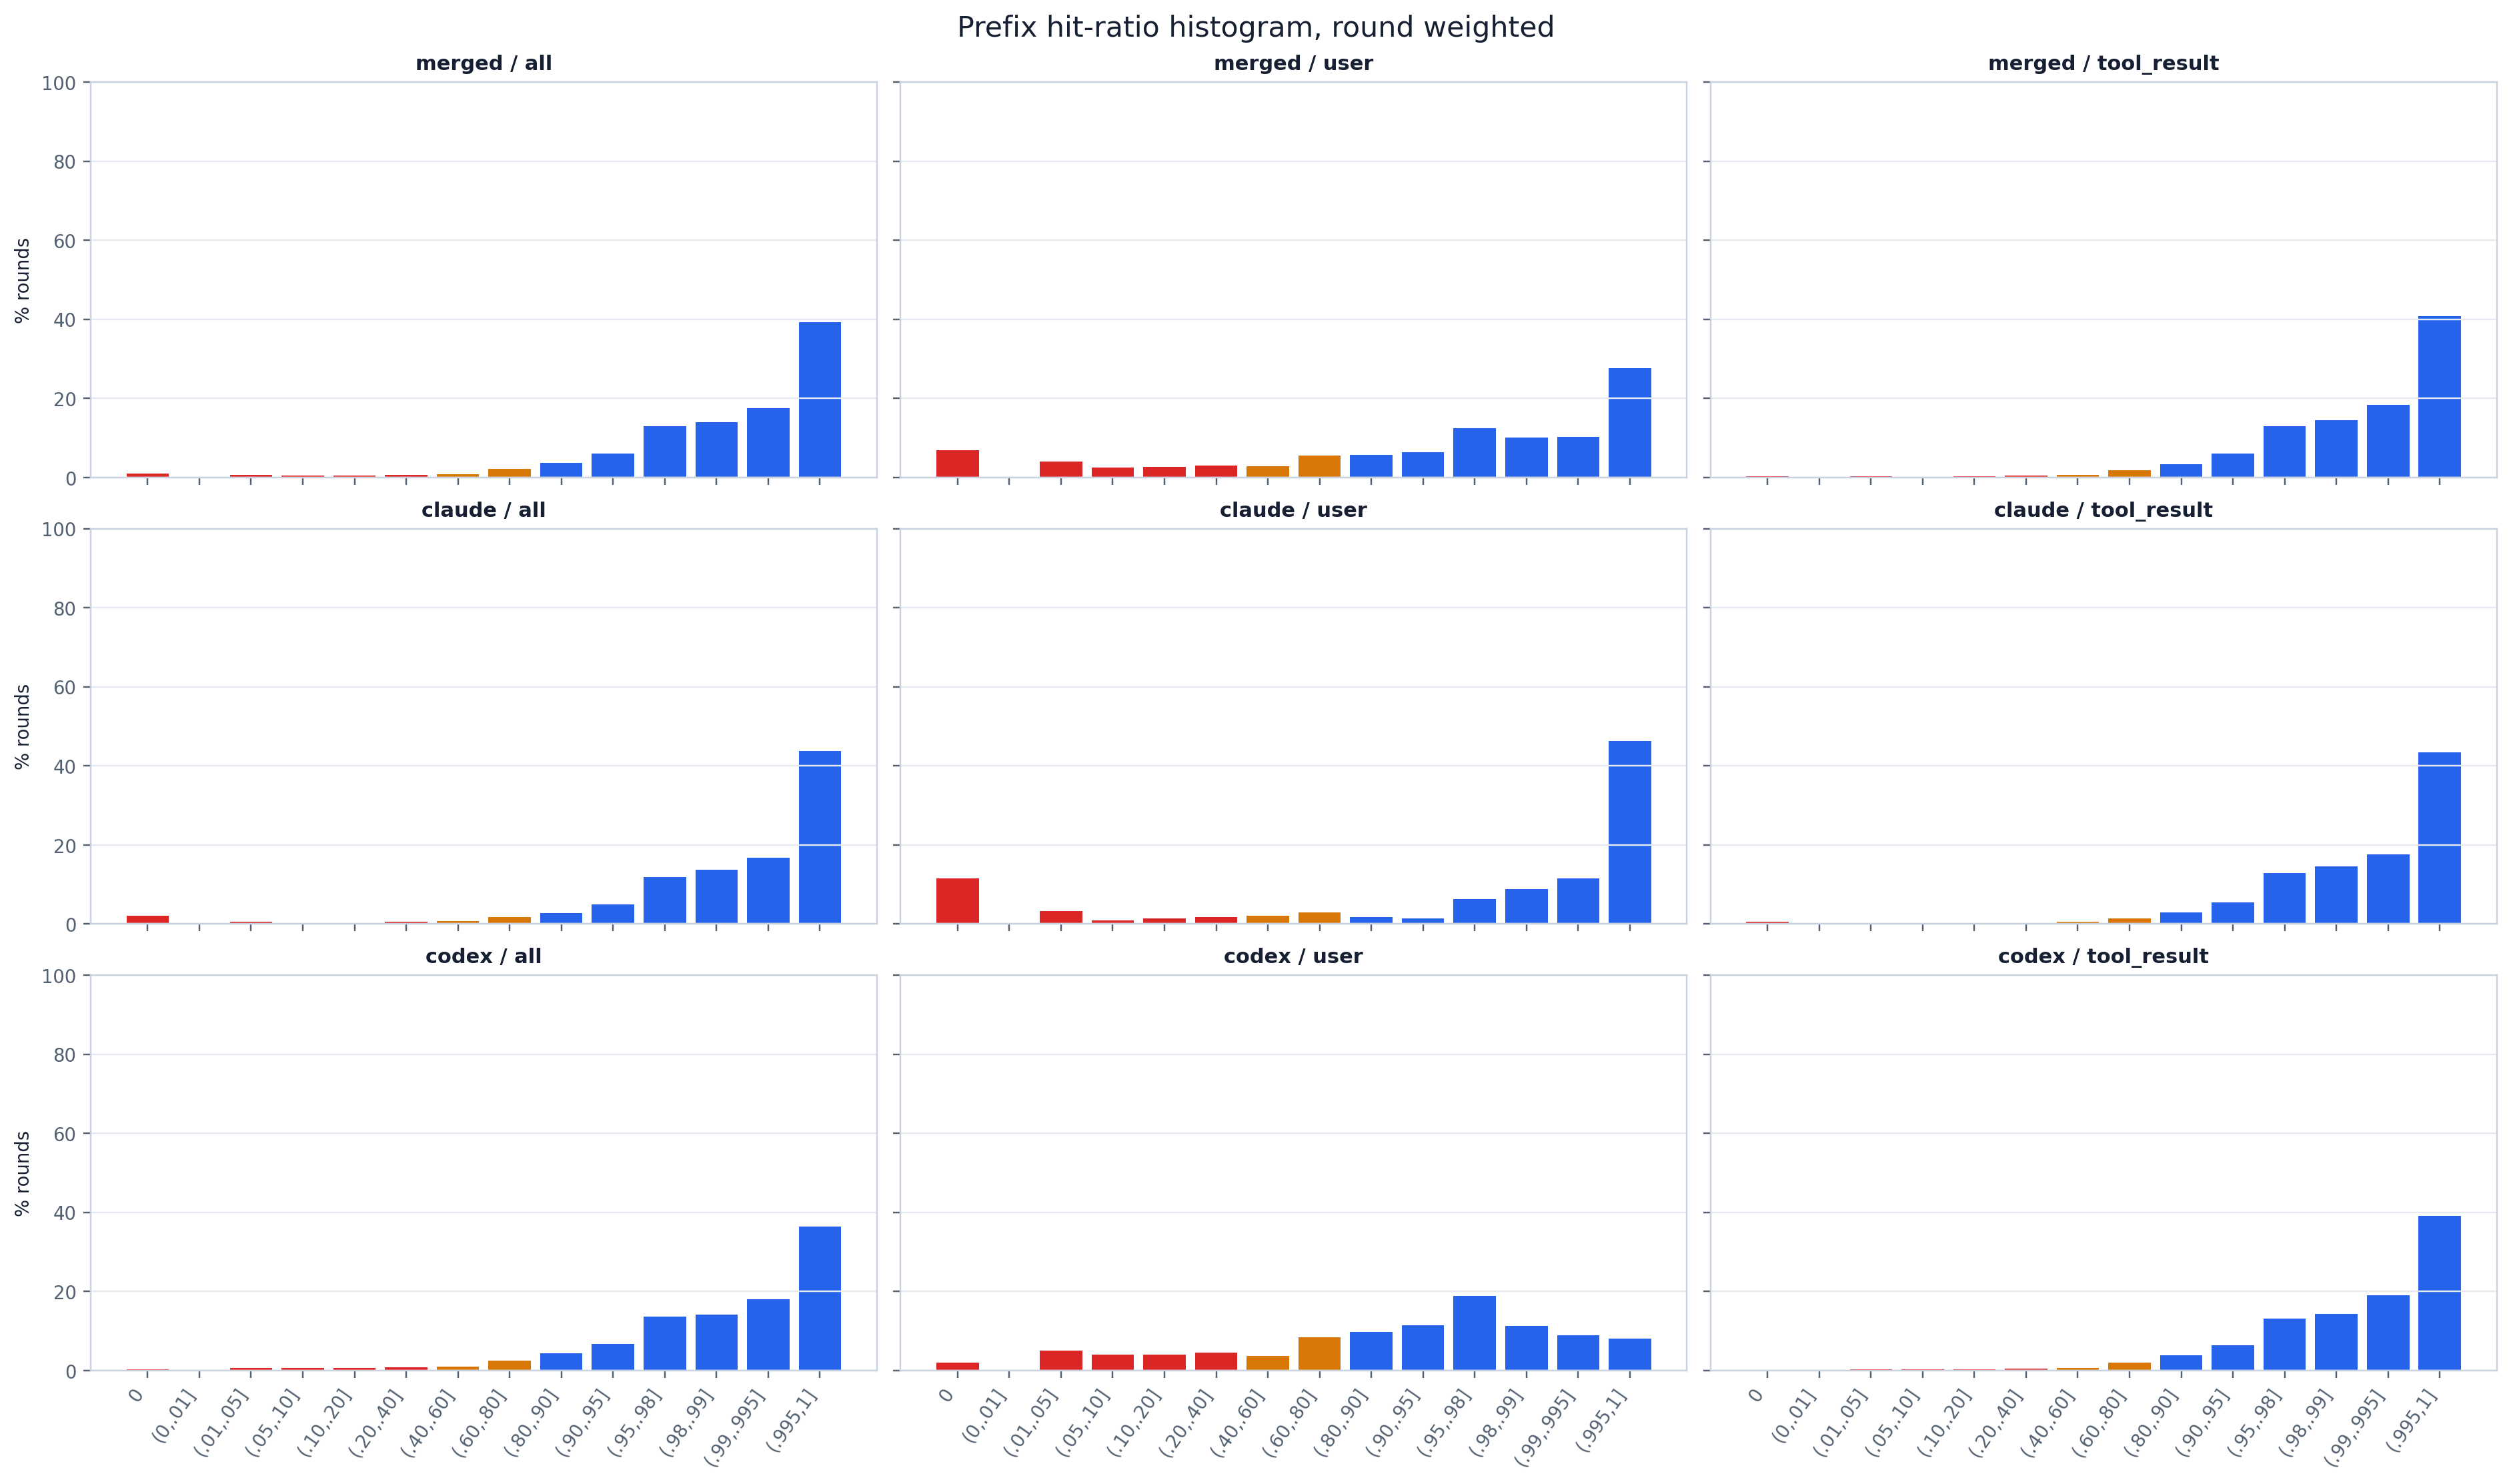
A scope × trigger grid of step-weighted hit-ratio histograms (bars colored red/amber/blue by
hit-ratio band). The dominant signal is a tall bar in the top (.99,.995]/(.995,1] bins: the
vast majority of steps are near-perfect cache hits, so coding agents pay for only a thin
freshly-appended slice each step. The split by trigger is the headline of tab:prefix_cache_hit_rate:
tool_result-started steps cluster hard at the high end (token-weighted ~97.5% hit, the prior context
resumes almost verbatim), while user-started steps carry a visible low-ratio tail (~84% hit) — a
fresh user message after a long human pause can invalidate more of the prefix. Compare the
per-provider rows against merged to see whether one provider drives the tail.
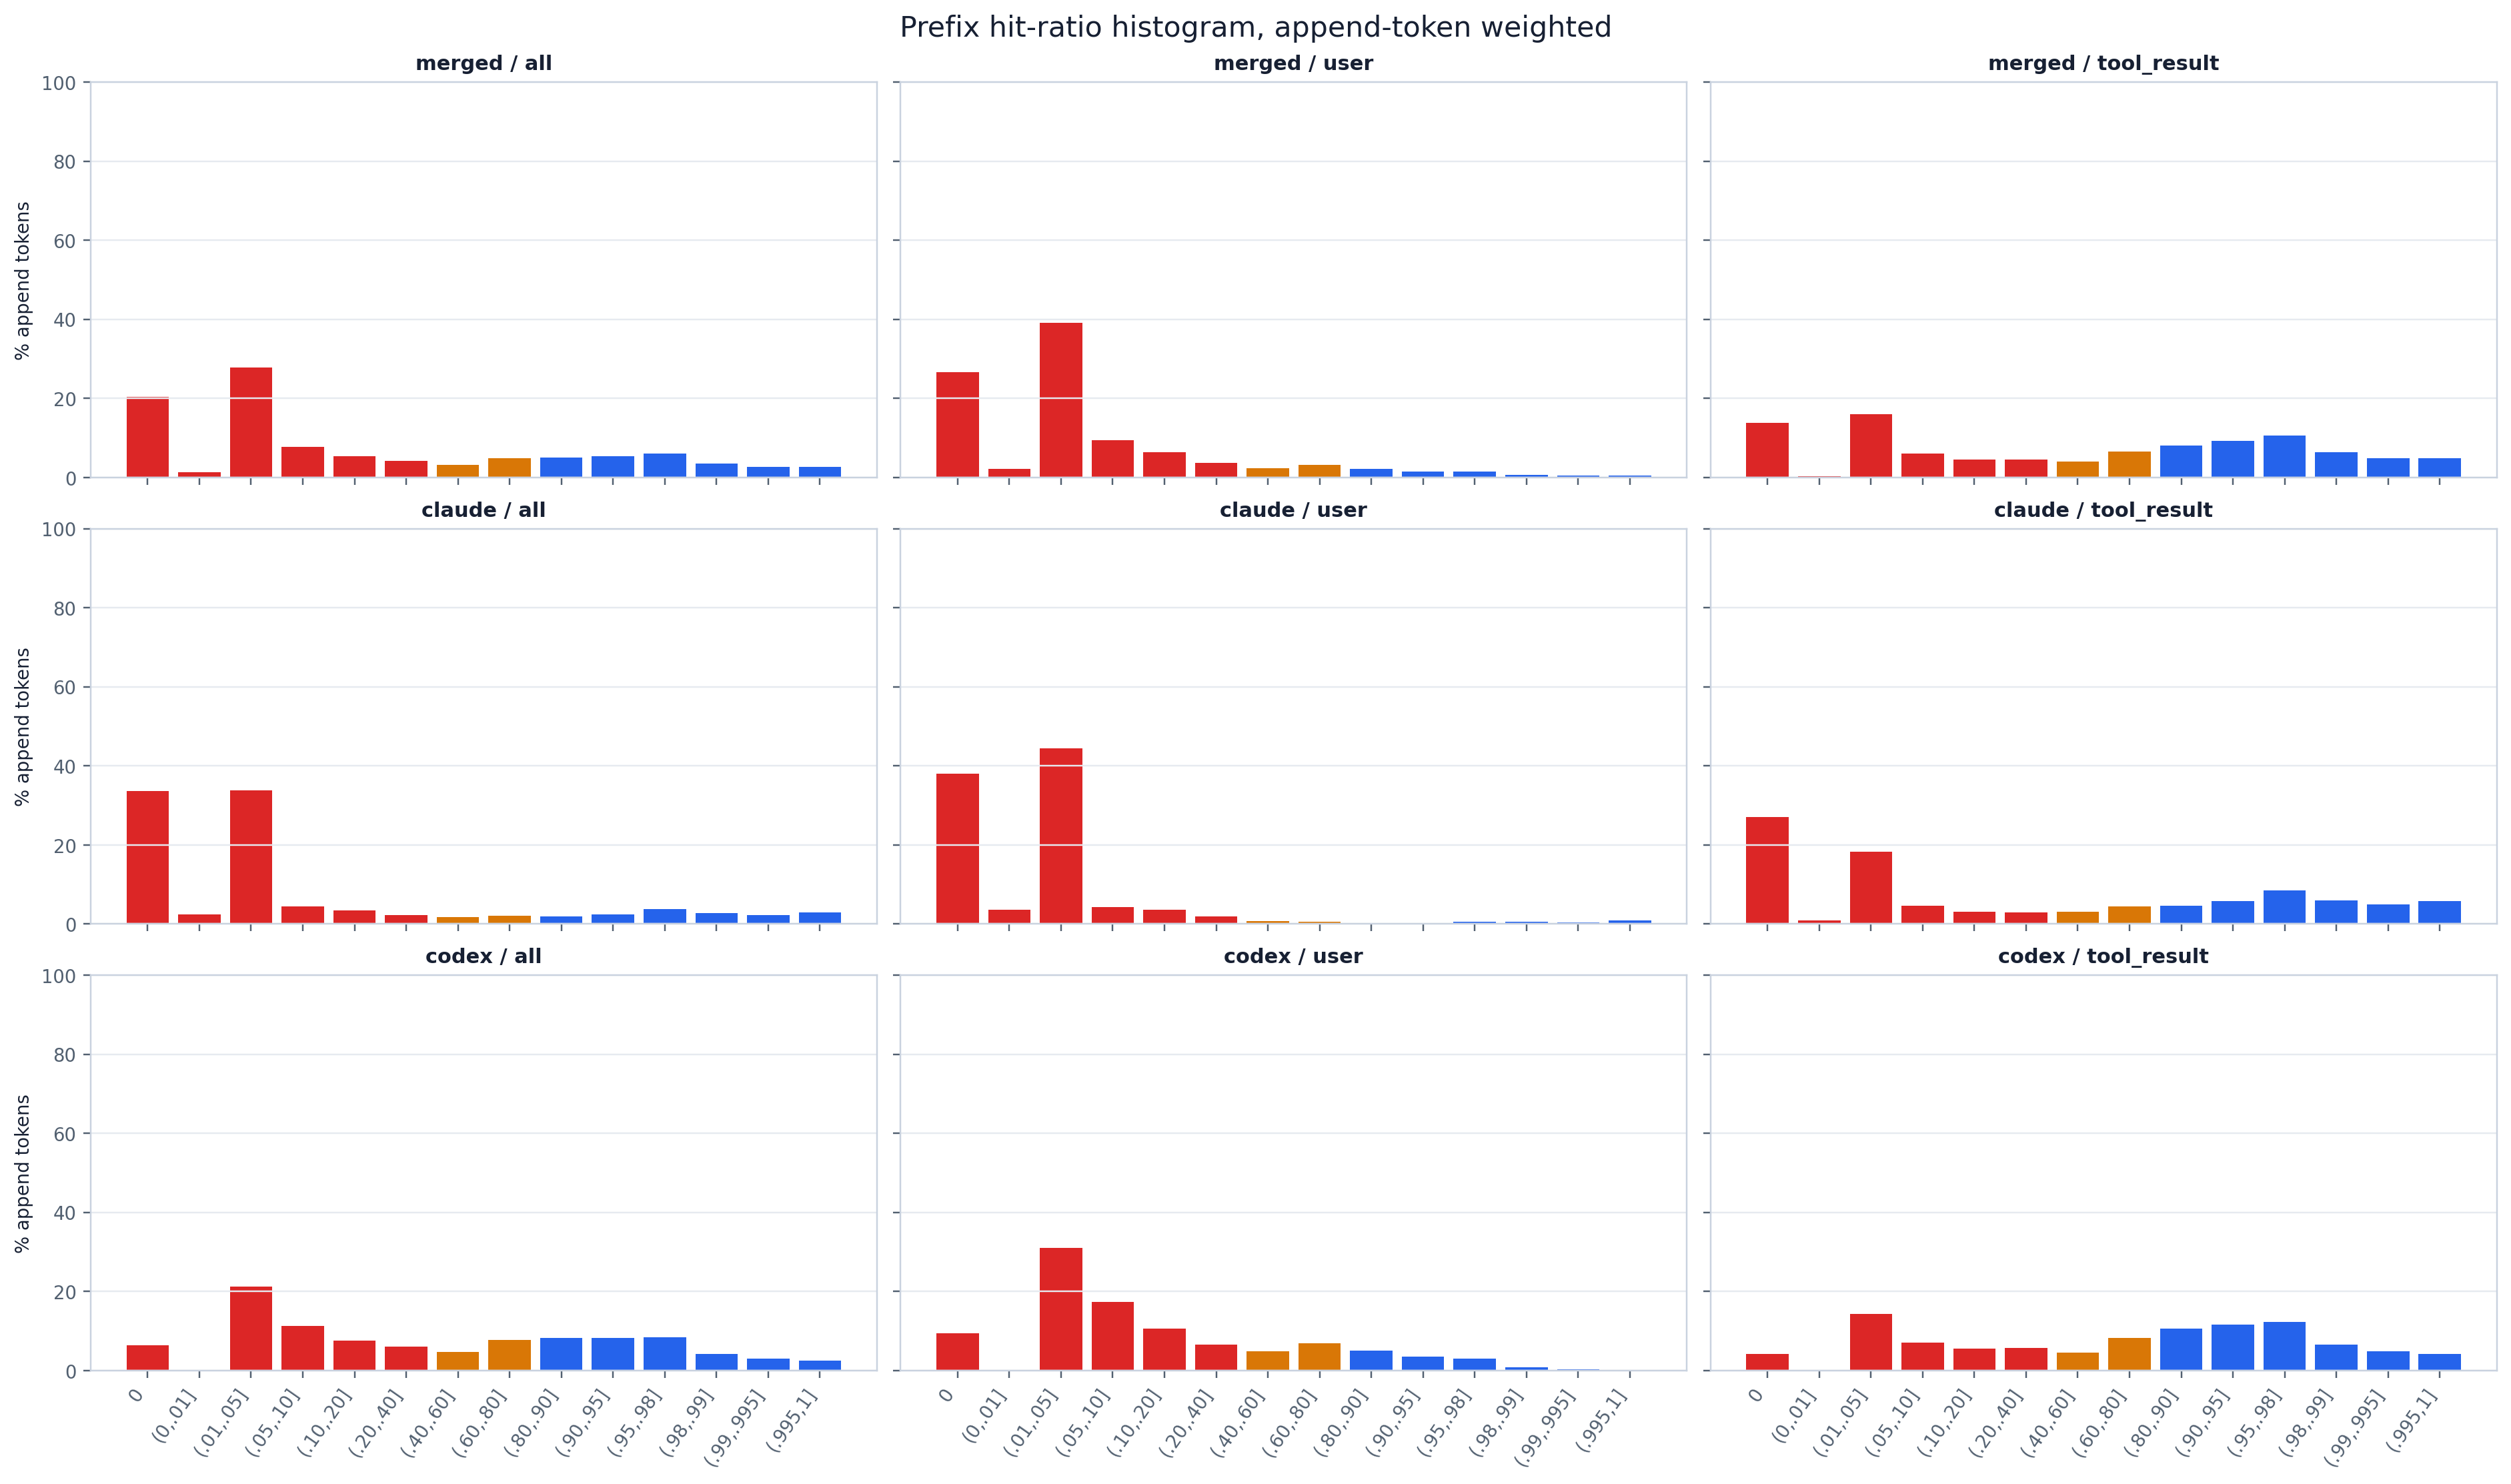
The same panels, but each step is weighted by its append tokens, so the bars show where the
token mass (and thus the billable cost) actually lands rather than where the step count lands.
The shape shifts markedly versus the step-weighted view: the high-hit bins shrink and the low-hit
bins grow, because the rare low-ratio steps are exactly the ones appending large amounts of new
text. Read this panel to find where new-token spend concentrates — cache_hit_ratio_summary.csv’s
append_hit_* columns give the exact mass shares per band.
| Metric | Claude | Codex | Total |
|---|---|---|---|
| Prefix cache-hit rate | 95.2% | 96.2% | 95.6% |
| Prefix hit rate (user-initiated) | 82.8% | 84.4% | 83.2% |
| Prefix hit rate (tool-result) | 98.1% | 97.3% | 97.8% |
The token-weighted hit rate by step type (the paper’s tab:prefix_cache_hit_rate). Caching is
uniformly high overall: both providers serve about 96% of prompt tokens from the prefix cache
(Claude 95.2%, Codex 96.2%). The interesting split is by trigger — user-initiated steps hit
much lower (82.8% Claude, 84.4% Codex) because human think time can stretch the idle gap past the
eviction window, whereas tool-result steps stay near-perfect (98.1% / 97.3%) since they resume
almost immediately. So the misses that remain are concentrated where the agent waits on a person,
not on a tool.
Every agent step in the trace carries an input-token accounting
(input_tokens_total = prefix_tokens + newly_append_tokens). This experiment treats the cached
prefix as a cache hit and the freshly-appended tokens as the miss, and reports the per-step
hit ratio, split by what started the step.
Method and assumptions:
prefix_tokens / (prefix_tokens + newly_append_tokens) per step — the
share of input tokens that were a cache read rather than newly charged.sum(prefix_tokens) / sum(prefix_tokens + newly_append_tokens).
The paper table uses all valid steps for the overall row, and first-event user_message /
tool_result steps for the trigger rows.timing_events with event_index = 1, the in-order first event) is a user_message or a
tool_result; all other first-event types (and steps with no timing events) are dropped. That
first event also sets the trigger: user for user_message, tool_result otherwise. The
first_input_event_type column is not used — it diverges from the first timing event (it
has nulls where a first timing event exists), so the legacy timing_events[0] semantics are
reproduced via the timing-events table.prefix_tokens and newly_append_tokens must be non-null, and their
sum must be > 0 (a zero/empty step contributes nothing and never divides by zero).np.percentile), histograms, and bins are computed over every eligible step via the shared
trace DuckDB — there is no reservoir cap.merged scope, under both its
trigger and the all trigger. Scopes reported: merged / claude / codex (a null provider
falls back to unknown). The append-weighted views weight each step by its append tokens to
show where the token mass sits, not just step counts.analyze.py is a query→shape→write/plot pipeline over the shared trace DuckDB:
read_groups(con) — one join of rounds to the first timing event
(timing_events WHERE event_index = 1), gated and ordered by round_pk (file order), returning
{(scope, trigger): HitRatioGroup} where each group keeps every step’s (hit_ratio, append_tokens). The cache-hit definition, eligibility gate, and provider/merged fan-out live
here.percentile(...) / hit_bin_index(...) / bin_color(...) — the exact percentile interpolation
and the fixed hit-ratio bin edges/colors shared by the CSVs and the figures.write_summary_csv / write_bins_csv / write_round_split_csv — the three CSVs.plot_histograms(..., weighted_by_append=...) — the SCOPES × TRIGGERS panel grid, rendered
once step-weighted and once append-token-weighted (matplotlib behavior unchanged from the
pre-migration script).main() — wires the standard trace_db CLI (--db | -i/--input | -o/--output-dir) to the
above and embeds the self-contained PNG sidecar.The data layer (parsing, surrogate keys, schema) lives in artifacts/utils/trace_db.py; see
artifacts/utils/DB_SCHEMA.md.
# default merged trace, output next to this README
uv run python artifacts/prefix_cache/cache_hit_ratio/analyze.py

# a specific trace (materialized to a temp DuckDB cache on first use)
uv run python artifacts/prefix_cache/cache_hit_ratio/analyze.py -i trace/sample.jsonl

# a prebuilt DB (run_all.py's build-db step passes this), into a chosen dir
uv run python artifacts/prefix_cache/cache_hit_ratio/analyze.py --db "$TMPDIR/trace.duckdb" -o "$TMPDIR/out"

# CSV-only (skip figures)
uv run python artifacts/prefix_cache/cache_hit_ratio/analyze.py --no-plots
cache_hit_ratio_histogram.png — step-weighted hit-ratio histogram, paneled scope × trigger.cache_hit_ratio_append_weighted_histogram.png — the same panels weighted by append tokens.cache_hit_ratio_summary.csv — per (scope, trigger): step/append counts, mean, percentiles
(p01…p99), and the step-share / append-share thresholds (<0.5, 0.5–0.9, >=0.9/0.95/0.98/0.99).cache_hit_ratio_bins.csv — per (scope, trigger, bin): step count + share and append-token
count + share across the fixed hit-ratio bins.cache_hit_ratio_round_split.csv — per (scope, trigger): step counts/shares across the coarse
<10% / 10-40% / 40-80% / 80%+ buckets.cache_hit_ratio_token_weighted.csv — token-weighted hit-rate inputs for the paper table.prefix_cache_hit_rate_table.tex — LaTeX table body for the paper.cache_hit_ratio_table.md — GFM Markdown mirror of that table, rendered on the web detail page.The PNGs are self-contained — they embed this README, the CSVs, and the plotting code (analyze.py
artifacts/utils/ modules). Unpack with
uv run python artifacts/utils/png_sidecar.py extract <png>.