
Inside a single coding session, how does the context window grow agent step by agent step — where do the user’s messages land, how much is cheap cached prefix vs. freshly appended input, and where does the agent compact and start over?
Inside a single coding session, how does the context window grow agent step by agent step — where do the user’s messages land, how much is cheap cached prefix vs. freshly appended input, and where does the agent compact and start over?
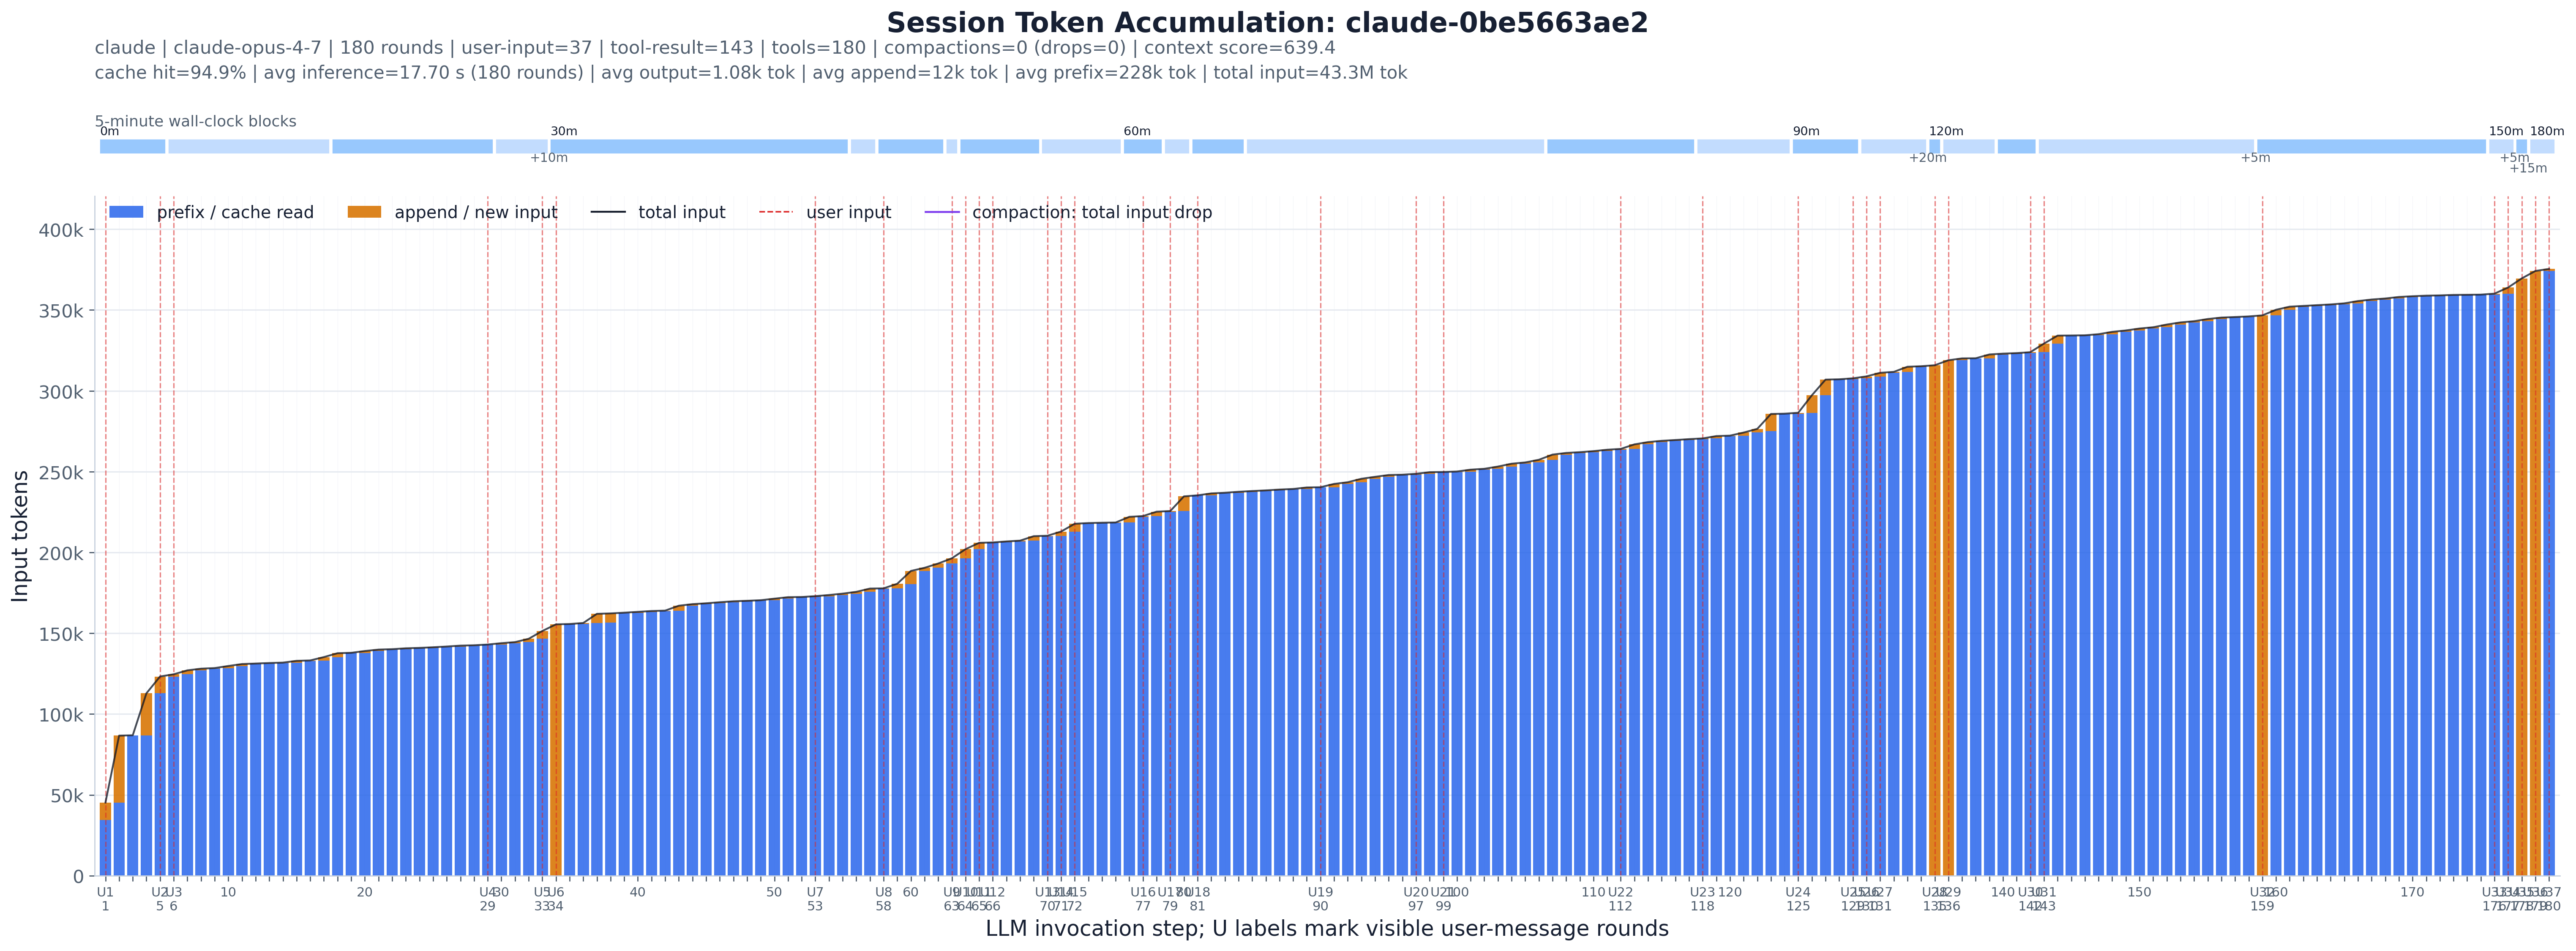
One session, watched step by step (the paper’s fig:session_progress_example; the filename is just
the session’s hash). Every figure reads the same way:
C markers are compaction — the running total collapses and the session restarts its
context; the bands show how many steps it lasted and whether it compacts once or repeatedly.U lines are user-initiated steps; wide gaps between them mean long autonomous tool-driven
stretches on a single instruction.Each row in the trace is one agent step. This experiment picks a handful of illustrative sessions and, for each, draws one bar per step: cached/prefix tokens (blue) stacked under newly appended input tokens (orange), with the running total input as a line on top. A thin top strip lays the same steps out on a 5-minute wall-clock timeline so you can see where the agent paused. It is the closest thing in the toolkit to watching a session breathe.
Method and assumptions:
(round_index, first-event timestamp, ingestion order). The ingestion-order tie-break is file order, so equal-timestamp steps never
reorder.prefix_tokens / newly_append_tokens;
their sum is the full input size for that invocation.U1, U2, …) are the steps whose timing events include a visible
user_message, i.e. where the human actually typed — as opposed to tool-triggered steps.--session-id.This is a hybrid experiment: the trace DuckDB does the single-pass ingest, and Python keeps the per-session heuristics (ordering, windowing, compaction detection, scoring) that don’t belong in SQL.
load_sessions_from_db(con) — three queries (step scalars, per-step timing events, per-step
tool counts), all in ingestion order, assembled into SessionStats objects. This is the only
data-loading code; everything below is unchanged from the pre-DuckDB version.RoundRow / TimingEvent — one invocation and its timing rows; first_observed_timestamp,
input_to_last_output_span_seconds, has_explicit_compaction_marker derive the per-step facts.find_compaction_markers(rounds) — the explicit + inferred-drop logic with the rebound guard.SessionStats — per-session rollups and the three selection scores.select_sessions(...) / select_window(...) — which sessions, and (if --max-steps) which
contiguous window of one.plot_session(...) — the stacked-bar + timeline figure; write_outputs(...) — the candidate CSV
and the selected-sessions JSON.The data layer lives in artifacts/utils/trace_db.py (see artifacts/utils/DB_SCHEMA.md).
# auto-select illustrative sessions from the default merged trace
uv run python artifacts/session/session_token_steps/plot.py

# a specific trace (materialized to a temp DuckDB cache on first use)
uv run python artifacts/session/session_token_steps/plot.py -i trace/sample.jsonl

# a prebuilt DB (run_all.py's build-db step passes this), into a chosen dir
uv run python artifacts/session/session_token_steps/plot.py --db "$TMPDIR/trace.duckdb" -o "$TMPDIR/out"

# pin exact sessions
uv run python artifacts/session/session_token_steps/plot.py --session-id <session_id>
Selection knobs: --top-sessions, --context-sessions, --compaction-sessions, the
--min/--max-rounds and --min-user-input-rounds / --min-tool-result-rounds filters,
--max-steps (window a long session), --candidate-limit (CSV depth). --select-offset /
--select-stride shard the selected set for parallel rendering.
<session>_token_steps.png — one figure per selected session (filename is a stable hash of the
session id).session_token_steps_candidates.csv — every ranked candidate session with its rollups and
scores; the selected column flags which were plotted.selected_session_token_steps.json — the exact selection and per-window metrics.Each PNG embeds this README, the candidate CSV, and plot.py. Unpack with
uv run python artifacts/utils/png_sidecar.py extract <png>.