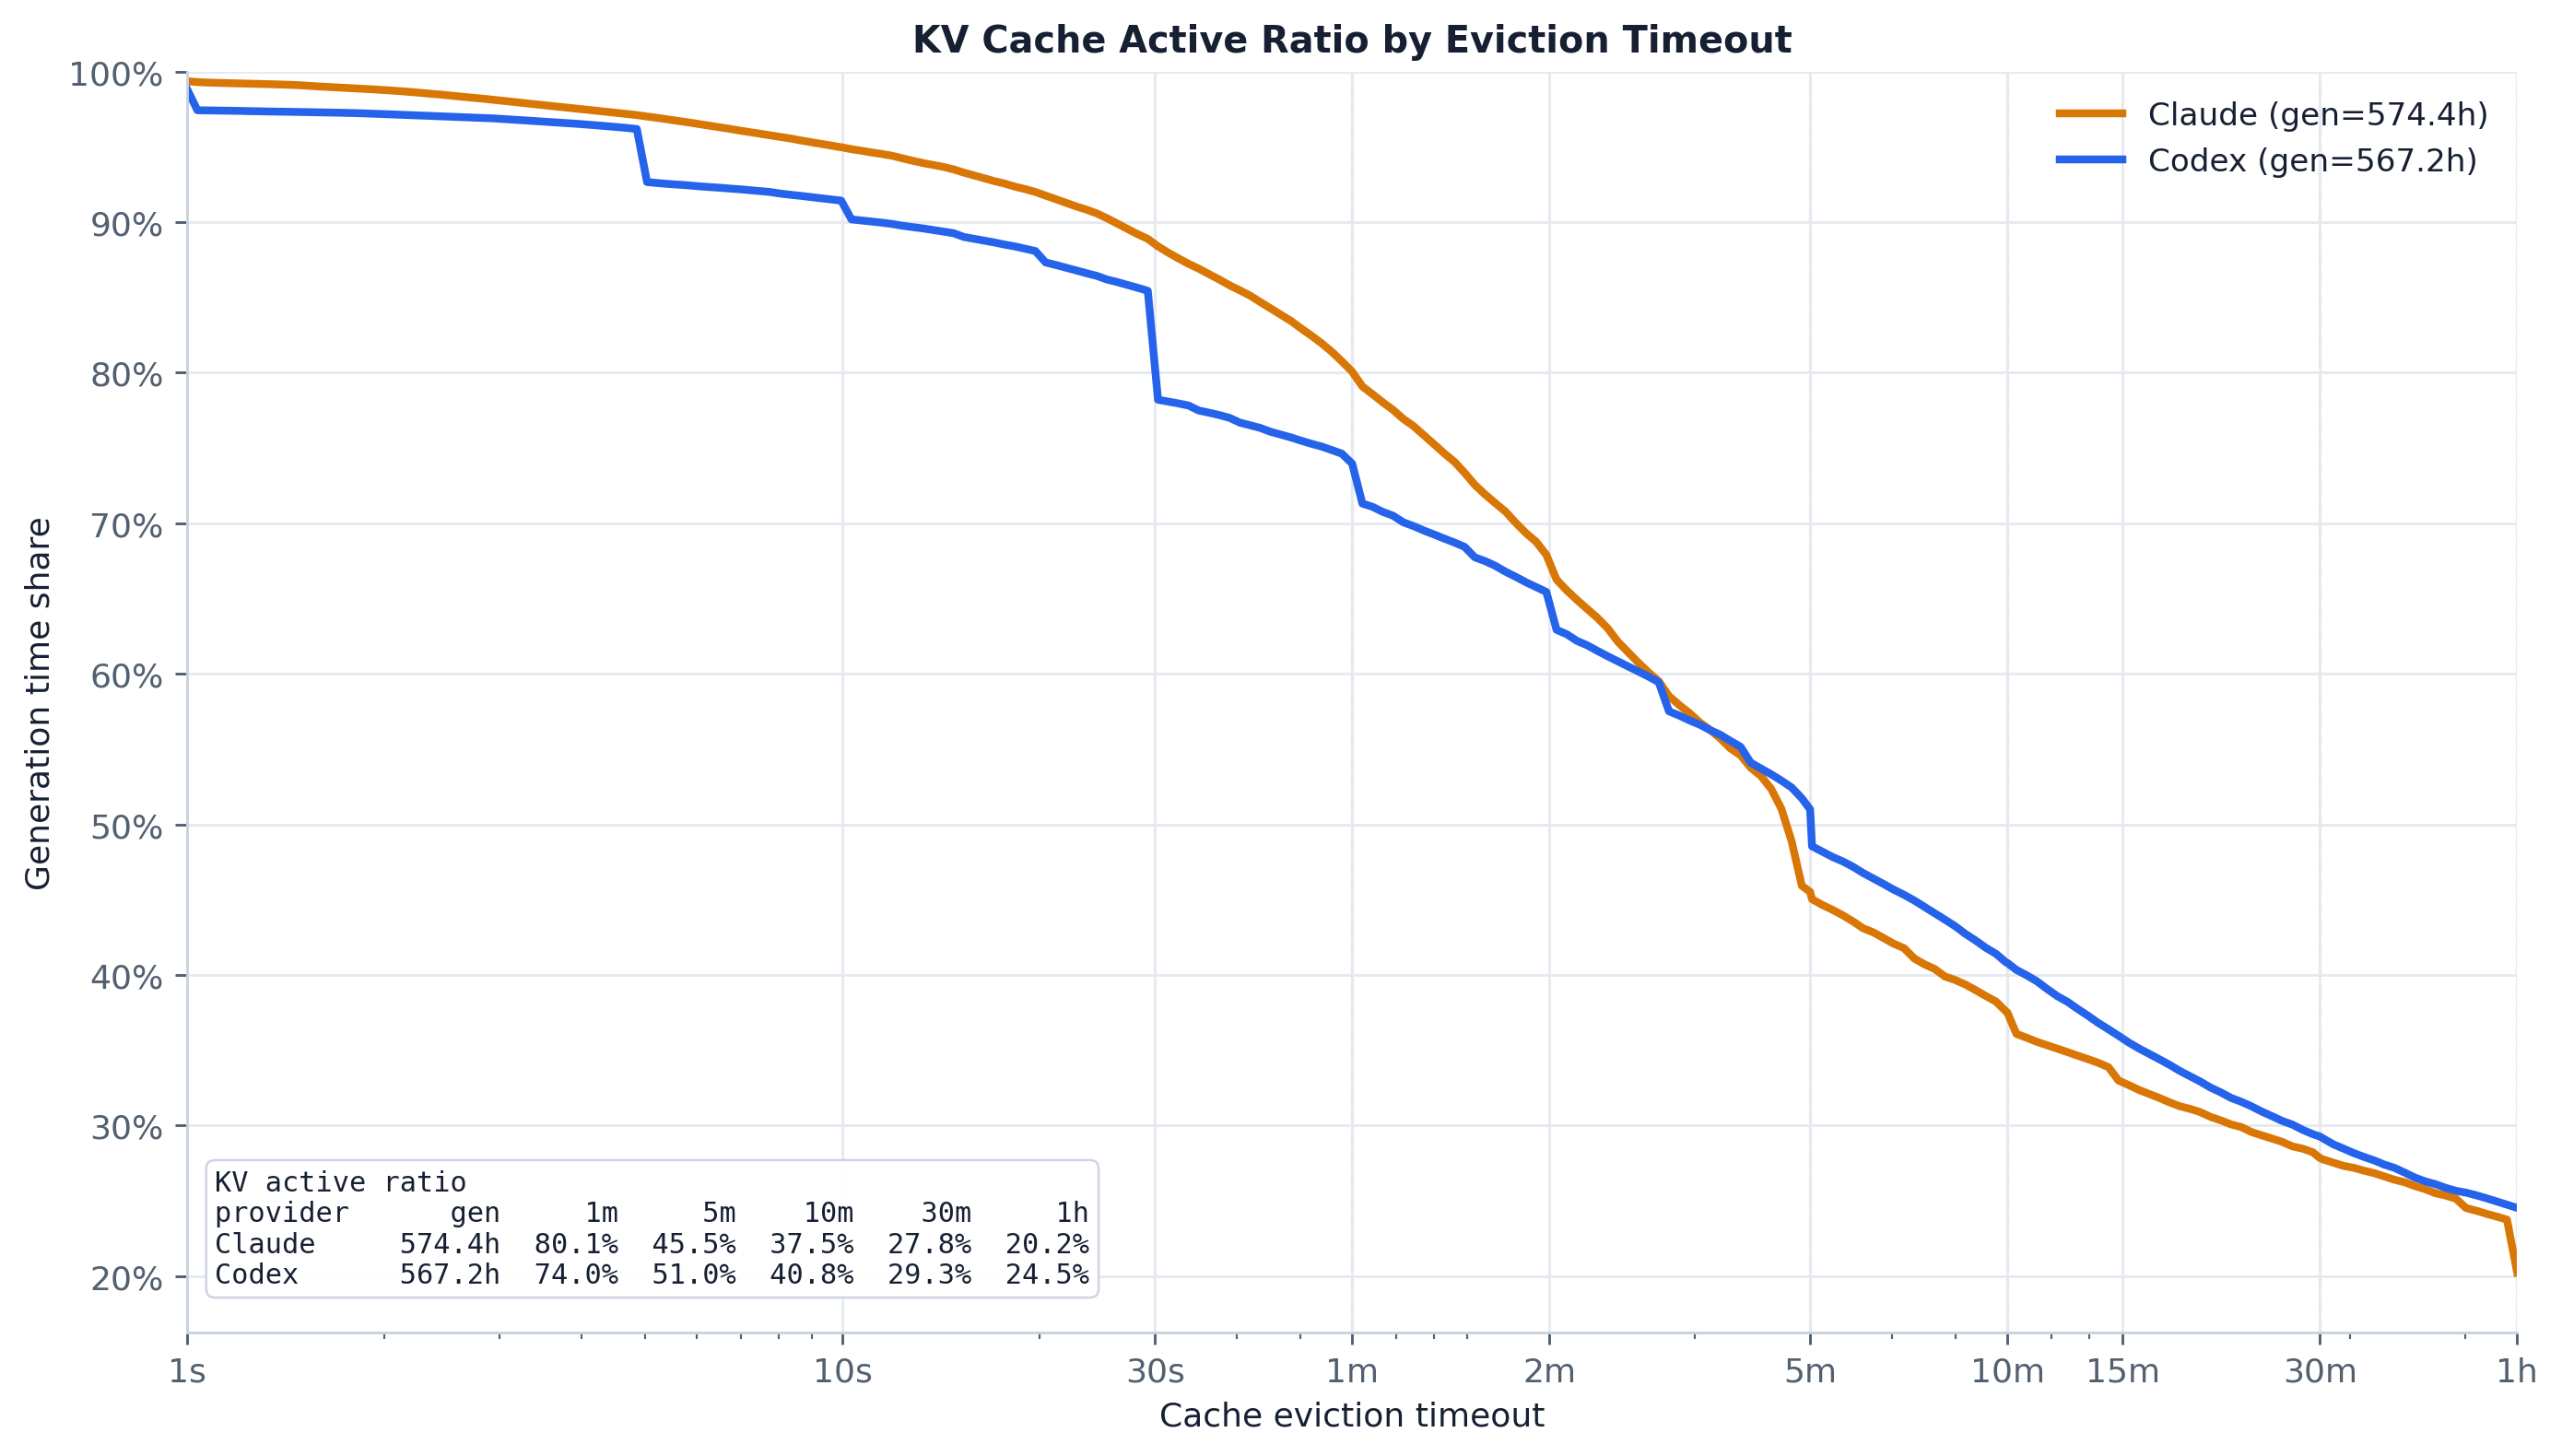
If a serving engine evicts a session’s KV cache after an idle timeout T, what fraction of total
wall time would the cache still be “active” (reused rather than rebuilt) — bounding how useful prefix
caching is across eviction policies?
For each candidate eviction timeout T (a fine log sweep from 1s to 1h, with the 1m/5m/10m/30m/1h
landmarks pinned in), the active ratio is
active_ratio(T) = gen_total / (gen_total + tool_total≤T + human_wait_total≤T)
evaluated per provider:
gen_total— the full observed generation total: the sum over agent steps of the input→last-output span (the time the cache is doing useful work). Only finite, strictly-positive spans are summed.tool_total≤T— cumulative time in tool waits whose individual effective latency is≤ T(short enough that the cache survives the gap; longer gaps are assumed to evict and so don’t count against active time). Effective tool latency is converted ms→s.human_wait_total≤T— cumulative time in inter-request human waits whose individual duration is≤ T, same survives-the-gap logic.
The cumulative-at-threshold sums (cumulative_values_at_thresholds_seconds) and the threshold grid
(kv_cache_timeout_thresholds_seconds) are the shared formatters.py helpers, unchanged.
Method and assumptions:
- Generation span per agent step mirrors
timing.input_to_last_output_span_seconds: withfirst_output = min(reasoning/text/tool_call timestamp)andlast_input = max(user_message or tool_result timestamp ≤ first_output), the span islast_output − last_input, kept only when strictly positive (a step with no qualifying input or output contributes nothing). - Effective tool latency =
tool_internal_latency_msif present, elsetool_wall_latency_ms(the sharedtrace_db.EFFECTIVE_TOOL_LATENCY_MS_SQLprecedence; the legacylatency_msfield is not in the normalized data). Only strictly-positive latencies enter the tool total. - Human input wait is the stateful inter-request gap, within a session, from the model’s previous
output to the next request-start user message, taken over agent steps in ingestion order
(
round_pk== file order). Only strictly-positive waits count. This matches thehuman_input_waitexperiment’s definition exactly. - Provider grouping mirrors the old loader’s
str(provider) or "<unknown-provider>"fallback (SQLCOALESCE(provider, '<unknown-provider>')), so a missing/empty provider lands in<unknown-provider>. - Exact, not sampled. All three inputs (per-step generation spans, per-call tool latencies, per-session human waits) are full lists — the old loader already kept every value here, with no reservoir cap on any of these metrics — so the migration is value-for-value identical and the output CSV is byte-for-byte unchanged.
- Engine-independent timestamps. Timestamps are read as integer epoch-microseconds
(
CAST(epoch_us(timestamp) AS BIGINT)) and differenced in SQL/Python, never fetched as a rawTIMESTAMP(native duckdb marshals that to adatetime, duckdb-wasm to a string). A difference of two same-timezone instants equals the naive-microsecond difference exactly, so spans and waits match the pre-DuckDB result bit-for-bit. - These are trace-level estimates, not engine timers.