
Agents do most of their real work through the shell — so which executables do those commands actually run, how often is each one used, and how long does each take?
Agents do most of their real work through the shell — so which executables do those commands actually run, how often is each one used, and how long does each take?
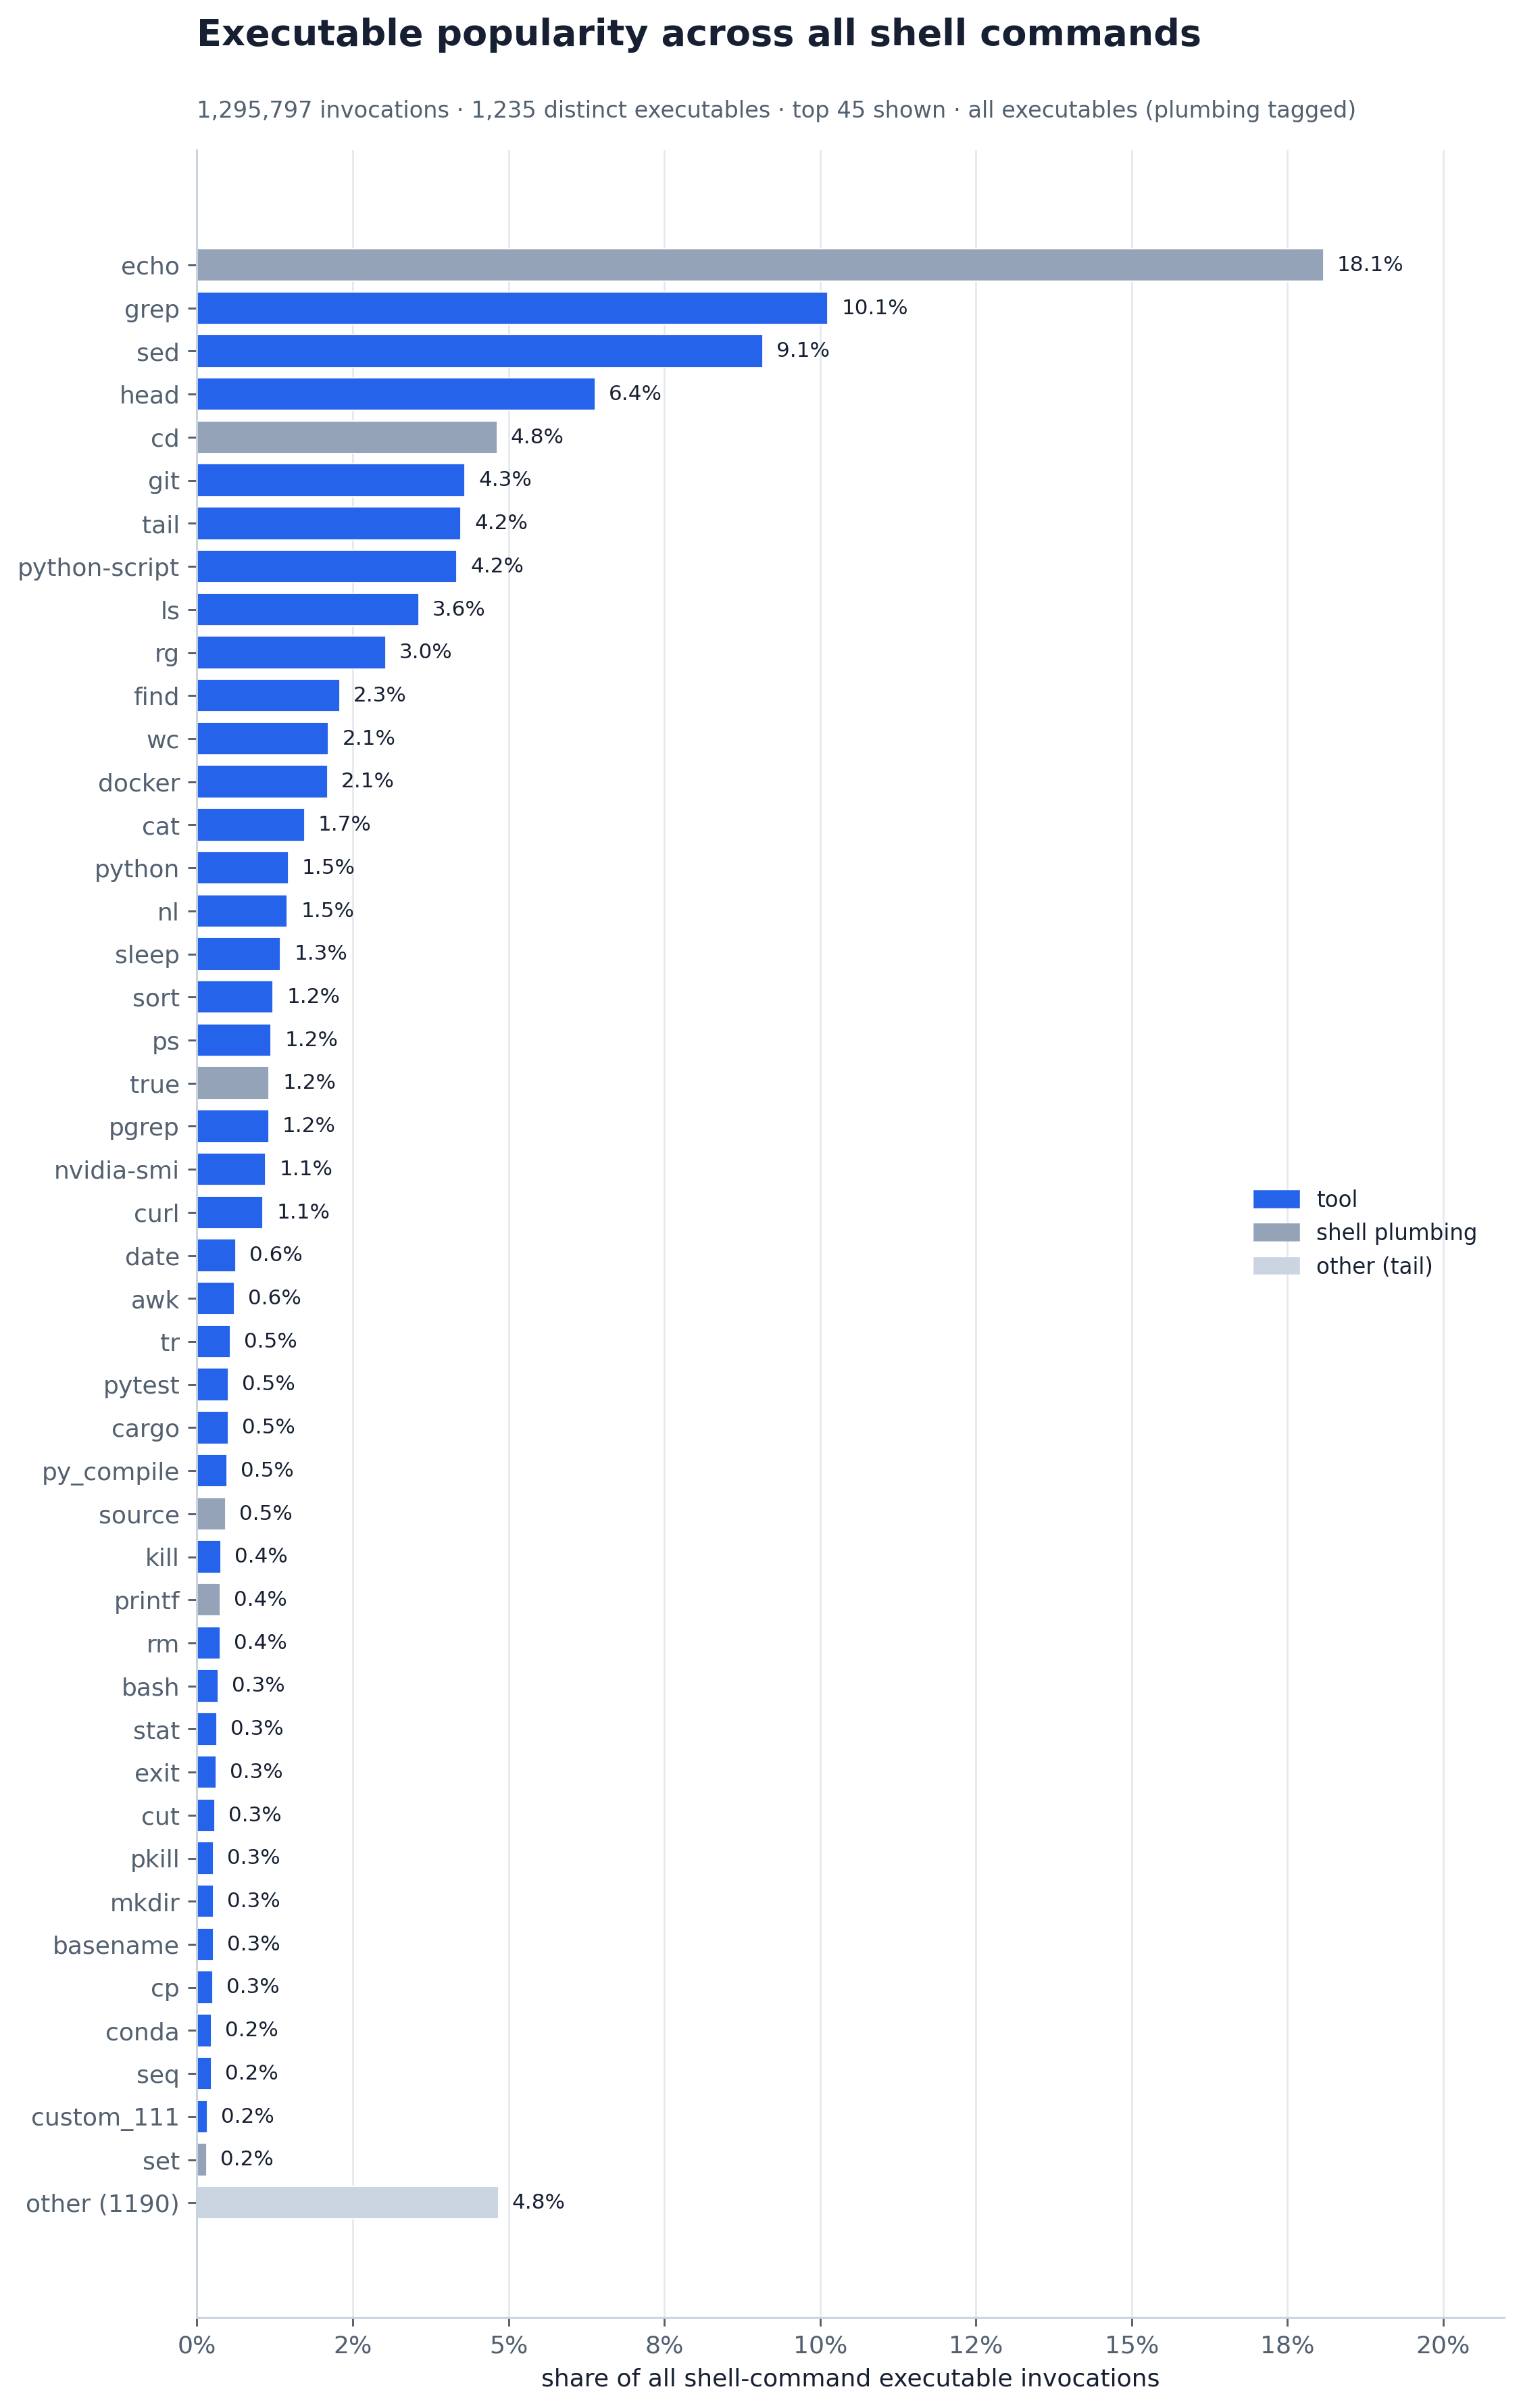
The pooled bar is each executable’s share of all shell-command invocations, and the working set is
dominated by text search/slicing plus glue. grep (10.1%), sed (9.1%), head (6.4%), rg (3.0%)
and tail (4.2%) lead the tools, alongside echo (18.1%, shell plumbing) and python-script (4.2%),
with git, ls, docker, find, nl, cd, wc, and cat filling out the head. So once commands
are broken into the programs they run, the
agents’ shell work is overwhelmingly reading, searching, and slicing files (plus printing progress) —
not launching heavyweight tools. Bars are tinted tool versus shell plumbing (echo/cd/true) so
the genuine tool set is separable from glue; the header carries the invocation total and the distinct
executable count.
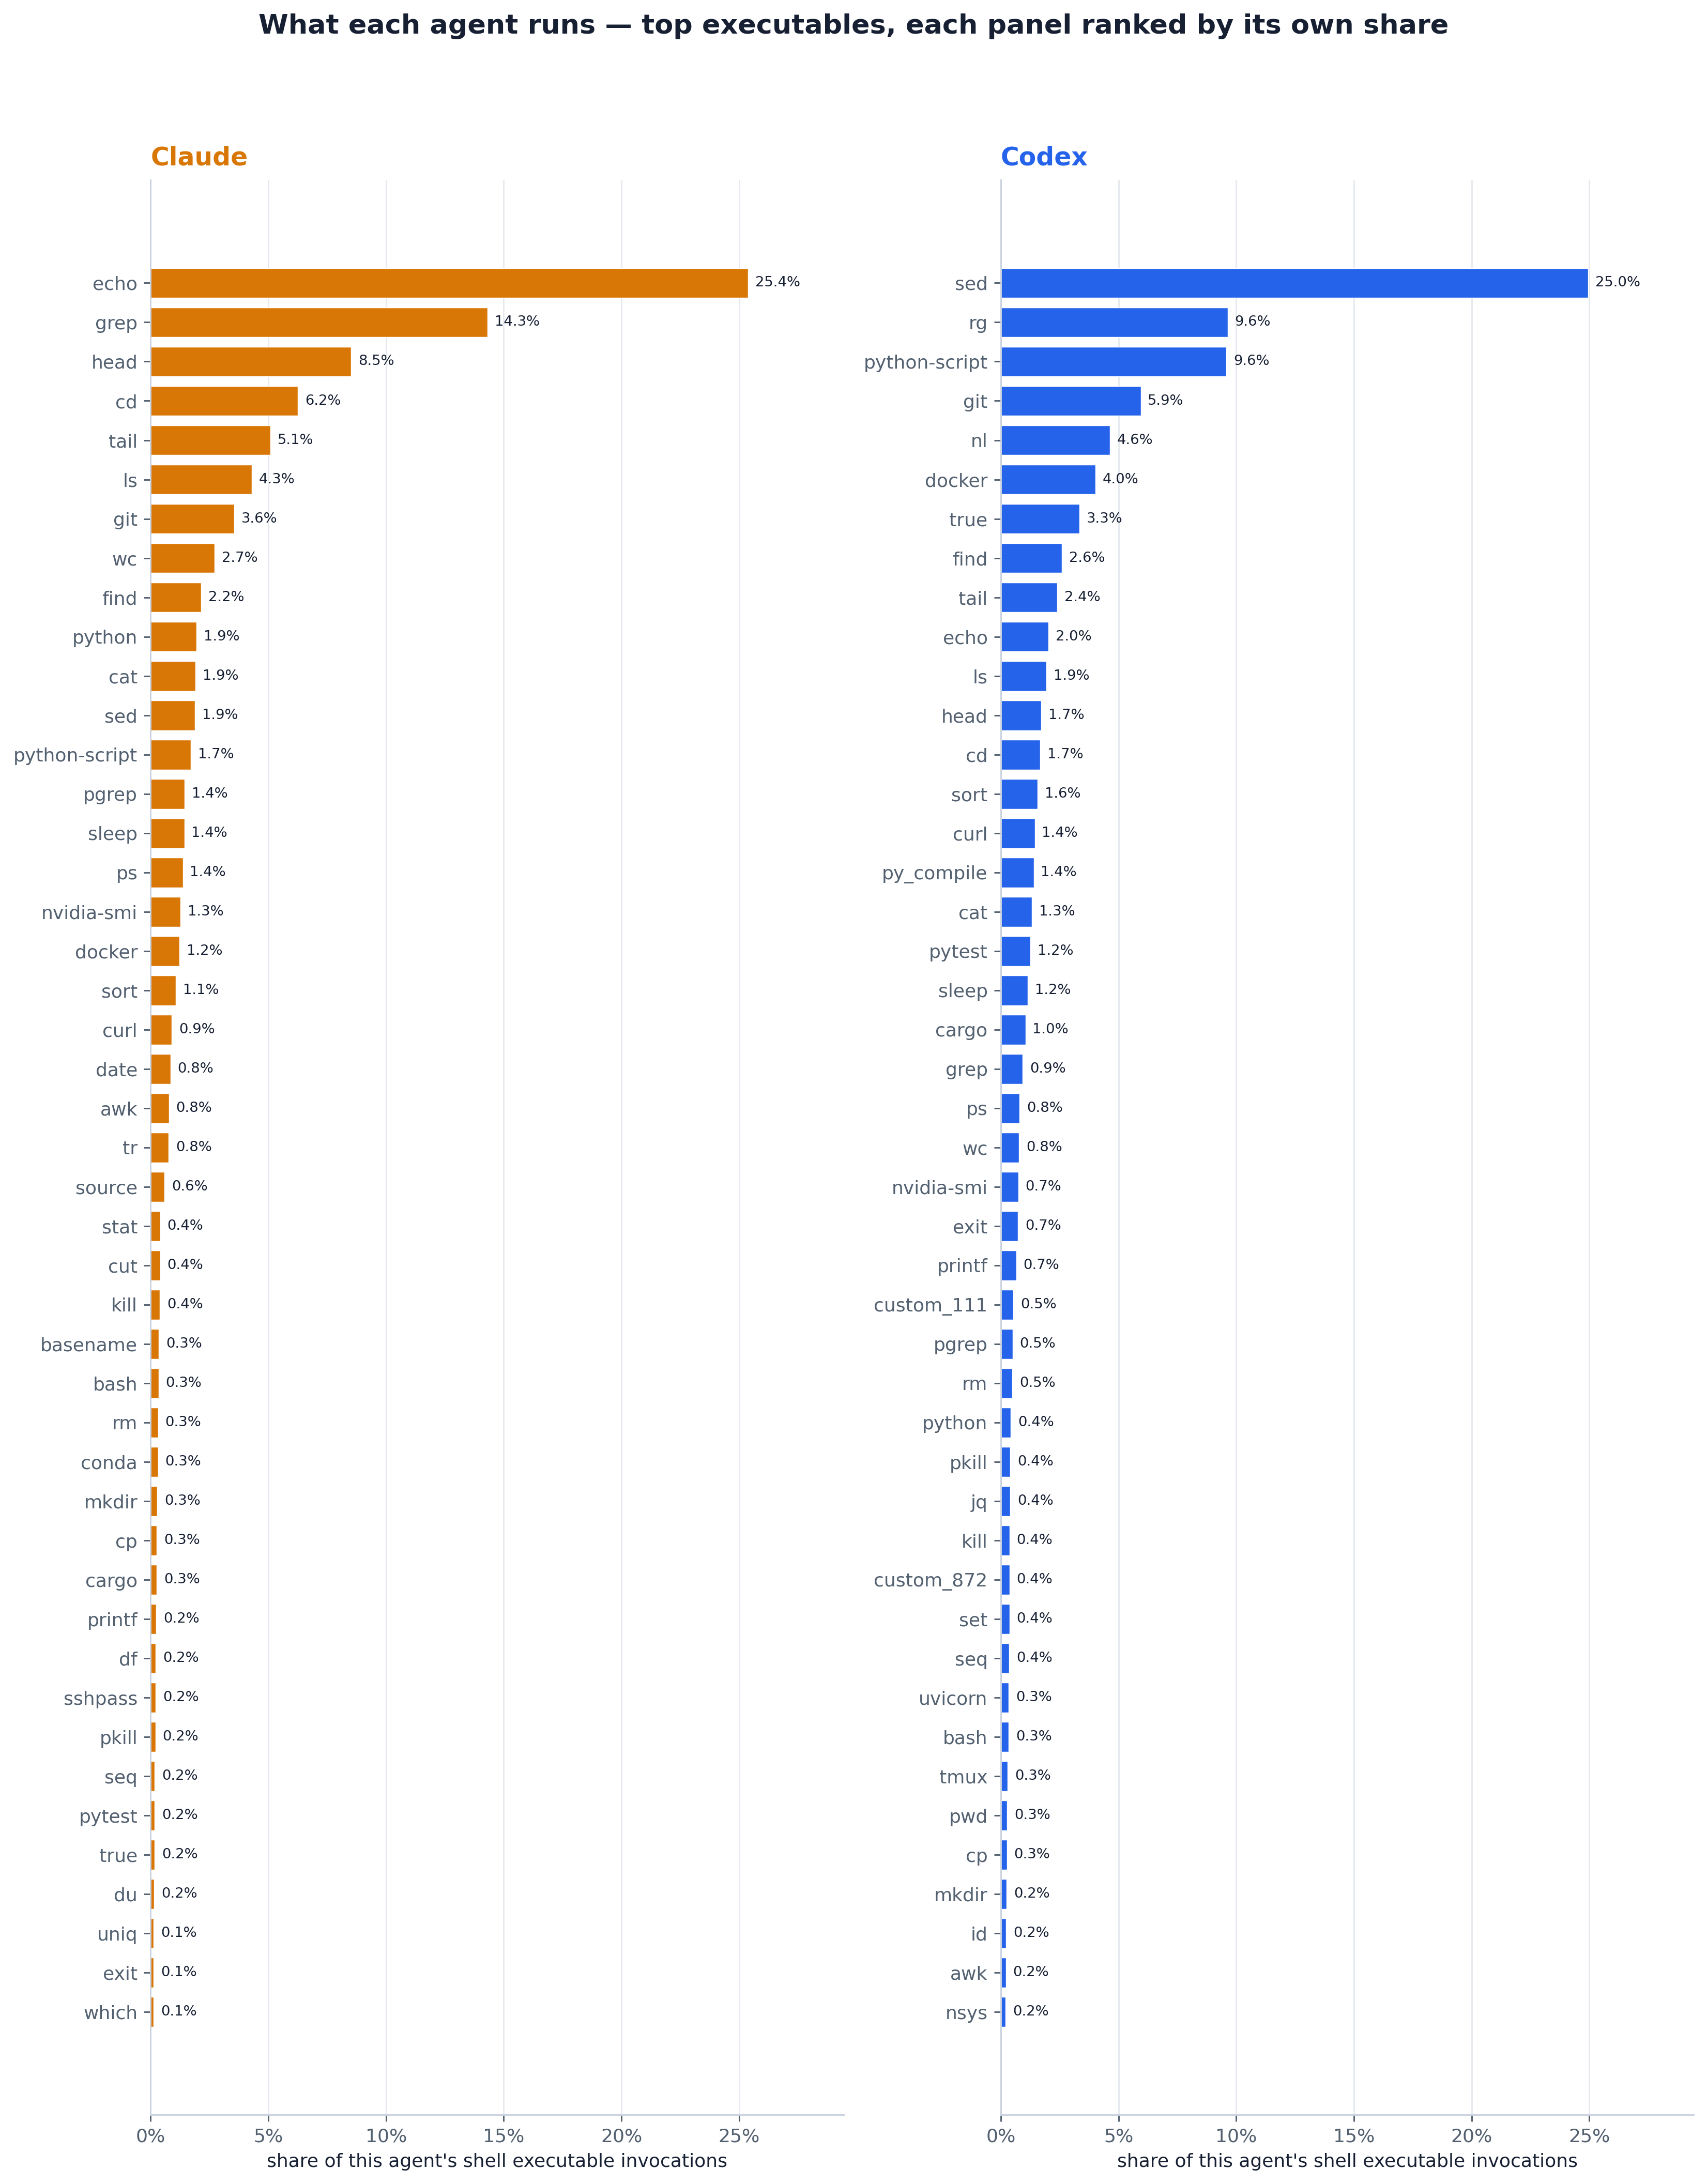
Ranking each agent by its own share exposes two different default toolchains for the same file work.
Claude leans on the classic pipeline utilities — grep (14.3%), head (8.5%), tail (5.1%), ls
(4.3%) — with echo (25.4%) its dominant progress-print idiom. Codex instead reaches first for
sed (25.0%), then python-script (9.6%), rg (9.6%), git (5.9%), nl (4.6%), and docker
(4.0%). So the
agents accomplish similar searching/slicing through distinct primitives: Claude via grep + head/tail,
Codex via sed + ripgrep + nl. This also explains Claude’s higher executables-per-call (≈5.6 vs ≈1.5):
it strings more of these small utilities together per command.
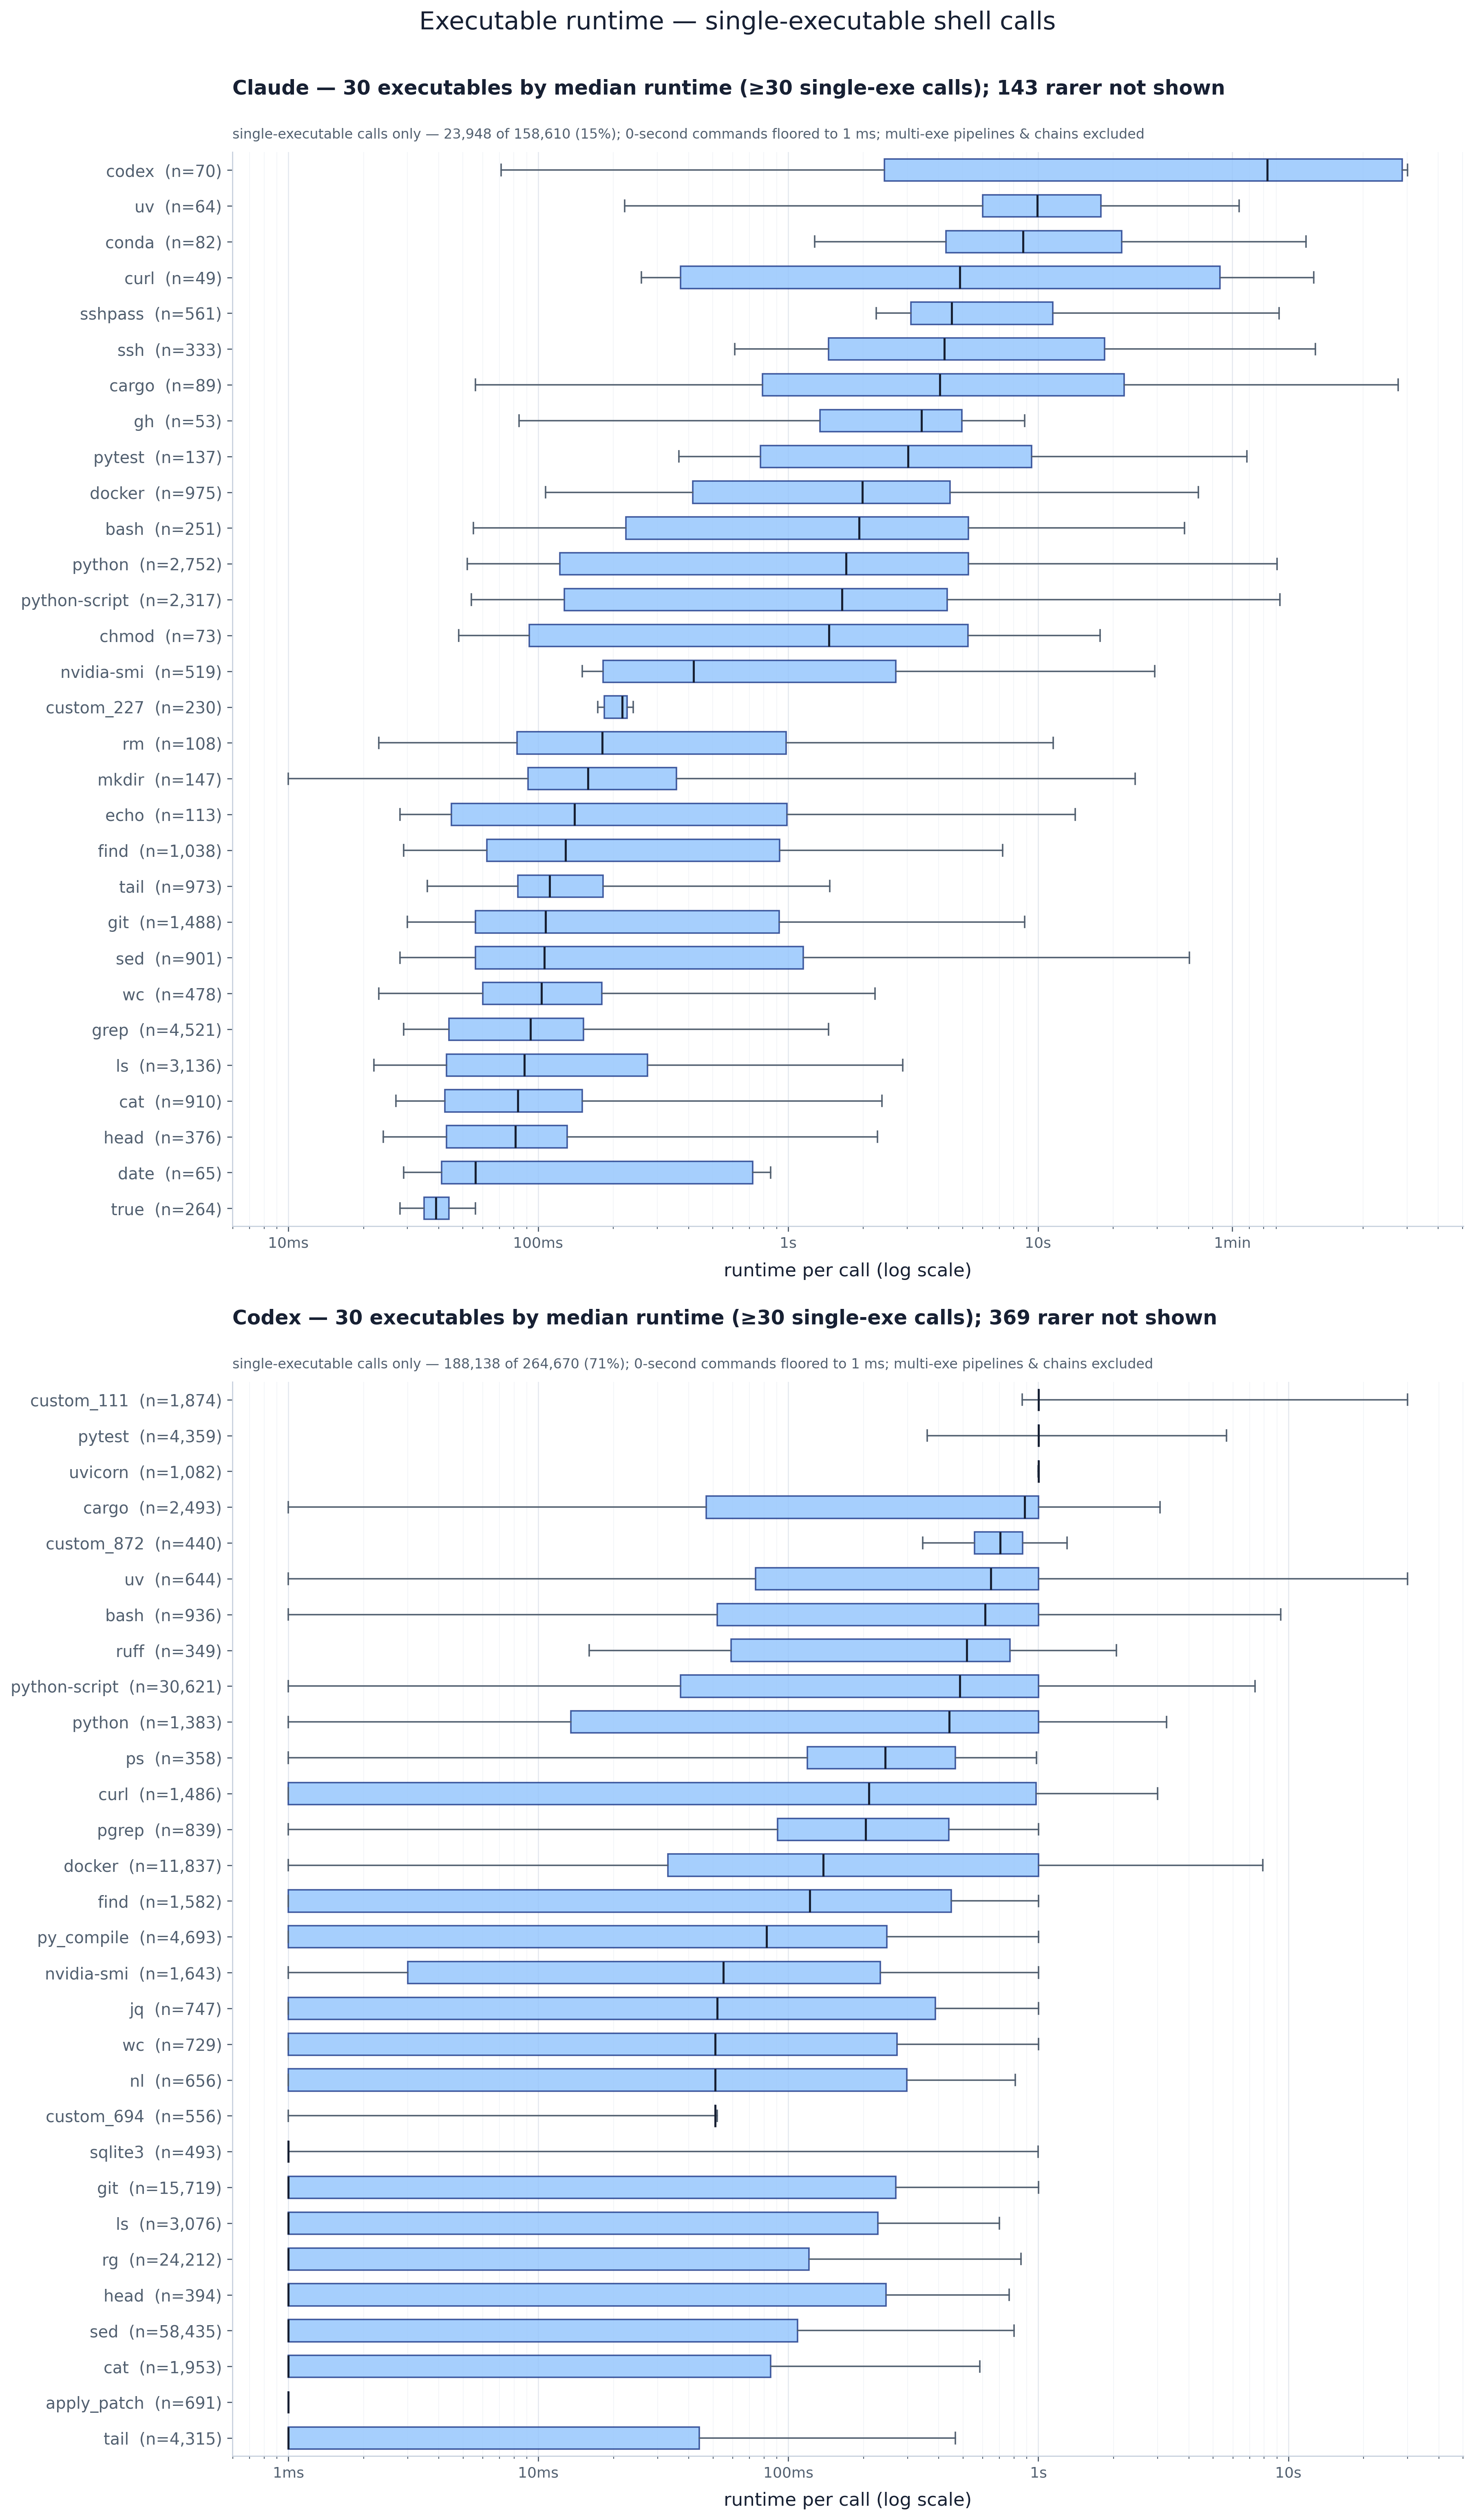
Per-executable latency over single-executable calls, one panel per agent, boxes ordered slowest-median
at top. Fast primitives (grep, ls, sed, rg, tail) sit at a few to tens of milliseconds,
while docker, pytest and python-script run seconds, with whiskers reaching tens of seconds (and
Codex’s 30s exec cap). Two things the figure makes explicit: only single-executable calls can be timed
— multi-exe pipelines/chains are excluded, which is ~85% of Claude’s calls, so the Claude panel is
drawn from a much thinner slice (its coverage subtitle) than Codex’s; and Codex clocks wall time in
whole seconds, so its many sub-second commands read 0s and are floored to 1 ms — hence the 1 ms floor
at the bottom of the Codex panel, versus Claude’s genuine millisecond spread. Read Codex medians with
that granularity in mind.
| Metric | Claude | Codex | Total |
|---|---|---|---|
| Command calls | 158,610 | 264,670 | 423,280 |
| Single-executable calls (n=1) | 24,285 (15.3%) | 188,371 (71.2%) | 212,656 (50.2%) |
| Multi-executable calls (n≥2) | 133,515 (84.2%) | 75,930 (28.7%) | 209,445 (49.5%) |
| Unresolved calls (n=0) | 810 (0.5%) | 369 (0.1%) | 1,179 (0.3%) |
| Executable occurrences | 891,000 | 404,797 | 1,295,797 |
| Executables per call (mean) | 5.62 | 1.53 | 3.06 |
| Distinct executables | 903 | 623 | 1,235 |
The call count includes shell-command launches: Bash, exec_command, shell, and shell_command. Aggregated effective time also includes write_stdin, because it waits on or continues an existing command. Time sums strictly positive per-call latency (internal when available, otherwise wall) and is additive over parallel calls.
| Metric | Shell-command tools | All tools | Share |
|---|---|---|---|
| Tool-call count | 423,280 | 743,819 | 56.9% |
Aggregated effective time (including write_stdin) | 1,747.74 h | 3,088.99 h | 56.6% |
Scope is the command/shell execute tools — the calls that run a shell command: Bash (Claude) and
exec_command / shell / shell_command (Codex). Every such call is classified by the
executable(s) it runs and timed by its per-call latency, then folded into one dataset the analyses
read.
Method and assumptions:
grep x | tail → grep+tail; git log && echo --- && git diff → git×2 (echo is
shell plumbing — counted but tagged, not dropped). Commands inside $(...) count (they run);
heredoc and apply_patch bodies are data, not commands.python -m NAME →
NAME, path → basename, synonyms). This names 98.86% of calls completely and
deterministically — no LLM, no endpoint. The ~1.14% partial/unresolved tail (dynamic program
names, parse errors) is retained honestly, never guessed.n_exe == 1): a pipeline/chain can’t
attribute one wall time across its stages. The original runtime view uses each tool call’s
effective latency. The updated view reconstructs continued Codex commands and measures from the
initial exec_command emission through the first linked result marked finished; incomplete,
aborted, and failed chains are excluded. Claude retains its effective per-call latency.Executable extraction now runs in the public-trace sanitizer. The sanitized JSONL and its DuckDB both store the same privacy-safe executable list, parse status/reason, and command skeleton. Everything here reads those stored facts; this artifact never needs raw command text.
One JSON row per shell/command call — the single source of truth for any executable/runtime question.
| field | meaning |
|---|---|
provider | claude | codex |
user, project | who ran it / which repo |
trace_key, session_id, round_index, tool_index, tool_call_id | call identity |
tool_name | Bash | exec_command | shell | shell_command |
command_skeleton | privacy-oriented executable/operator form with reserved <...> structure tokens; "" only if unparseable/empty |
latency_ms | per-call latency (tool_internal_latency_ms else tool_wall_latency_ms); null if none |
executables | list, one entry per occurrence (["git","git"]); [] if opaque |
kinds | aligned with executables: "tool" | "plumbing" |
n_exe | len(executables) |
executable_parse_status | success | partial | failed |
executable_parse_reason | why a call is partial/failed (dynamic/parse-error/…), else null |
Three standard reads: popularity counts executables[] across all rows; runtime keeps rows
with executable_parse_status == "success" and n_exe == 1 and a latency value (0-second calls floored to
1 ms); updated runtime applies the same attribution filter but replaces Codex exec_command
latency with the observable full-command duration reconstructed from the normalized continuation
links.
command_skeleton strips arguments and transparent wrappers while retaining normalized executable
names and |/&&/||/;/&/!: git status && grep x file | head -10 →
git && grep | head. Explicit semicolons and top-level newlines both canonicalize to ;. Complex
syntax becomes a reserved structural token instead of leaking its body: <loops>, <substitution>,
<assign>, <conditional>, <subshell>, <unknown>, or <function>. For example,
X=foo; echo "$(git status)" → <assign> ; echo <substitution>. The ordinary executables[] list
still keeps individual labels it can safely recover from complex commands.
In the current merged trace, 334,911 of 335,640 calls (99.7828%) have a non-empty skeleton. Only 729 remain empty: 665 parse errors, 23 HTML-escaped inputs, 20 empty/undecodable inputs, and 21 comment-only or otherwise structureless inputs. Placeholder/operator categories overlap.
scripts/executable_facts.py — shared tree-sitter Bash extraction and skeleton logic used by the
sanitizer.scripts/sanitize_round_trace.py — extracts the facts, preserves explicitly whitelisted
public/common names, and maps every other executable consistently to custom_N.classify_commands.py — a small DuckDB exporter/statistics step over the stored public fields.analyze_popularity.py — one tally per executables[] entry → executable_popularity.csv + the
pooled, per-provider, and compact top-15 per-provider figures.analyze_executable_runtime.py — single-executable latency box plots plus each provider’s top 15
executables by summed raw latency → runtime and total-latency CSVs + figures.analyze_executable_runtime_updated.py — the same attribution and visual design, with continued
Codex commands timed through their terminal write_stdin result → updated runtime and top-15
summed completion-time CSVs + figures. It needs a DuckDB built from the same trace.analyze_command_stats.py — coverage/shape statistics plus the shell-command share of all tool
calls and summed effective tool time → command_stats.json + command_stats.md (the website
tables). Counts cover command launches; summed time additionally includes Codex write_stdin
continuation/wait calls. All-tool denominators come from the adjacent exact tool_time_by_kind
CSV, and the script cross-checks that its shell-launch slice matches command_calls.jsonl before
writing.sanitize_executables.py + scripts/public_common_executables.txt — a conservative privacy-review pass.
Exact whitelisted names remain visible; every other executable is proposed as custom_N. Normal
runs depend only on the frozen whitelist, never the host environment. The sanitizer imports these
frozen decisions.The full dependency-ordered pipeline is registered in the shared dispatcher:
uv run python artifacts/run_all.py --only tool_calls/bash_command_breakdown
It runs classify_commands first, launches the independent popularity/runtime
consumers afterward, and waits for both classify_commands and
tool_time_by_kind before producing command_stats.
The equivalent manual commands are:
BASE=artifacts/tool_calls/bash_command_breakdown
DB=trace/syfi_coding_trace.duckdb

uv run python $BASE/classify_commands.py --db $DB
uv run python $BASE/analyze_popularity.py               # popularity CSV + 3 figures
uv run python $BASE/analyze_executable_runtime.py       # runtime CSV + figure
uv run python $BASE/analyze_executable_runtime_updated.py --db $DB
uv run python artifacts/tool_calls/tool_time_by_kind/plot.py --db $DB
uv run python $BASE/analyze_command_stats.py            # command_stats.json + command_stats.md
uv run python $BASE/sanitize_executables.py             # private review CSV + mapping
Flags — classify_commands.py: --db or -i/--input, -o/--output-dir, --tools.
analyze_popularity.py: --top (45), --tools-only. analyze_executable_runtime.py:
--min-calls (30), --top (30), --tools-only. The updated runtime script has the same plotting
flags plus required --db. analyze_command_stats.py:
--all-tool-stats (the matching tool_total_time_by_kind.csv).
Generated outputs are gitignored. The six .py scripts, this README, and the reviewed executable
whitelist are tracked.
| file | contents |
|---|---|
command_calls.jsonl | the centralized dataset — every call, executables + latency |
executable_popularity.csv + 3 PNGs | ranked usage, pooled, per-provider, and compact top-15 per-provider |
executable_runtime.csv + PNG | per-executable raw-latency percentiles + box plots |
executable_total_latency_top15.csv + PNG | each provider’s top 15 executables by summed raw latency |
executable_runtime_updated.csv + 3 PNGs | per-executable observable full-command duration percentiles + box plots, including stacked and left-right provider-colored 100 ms views |
executable_total_latency_updated_top15.csv + PNG | each provider’s top 15 executables by summed completed-command time |
command_stats.json / command_stats.md | coverage/shape stats + the website table |
executable_privacy_review.csv | private: all original names, proposed class, and public label |
executable_sanitization_mapping.json | private: domain-specific name → custom_N mapping |
scripts/public_common_executables.txt is an exact-match allowlist. Its initial bootstrap included only
observed Bash builtins, commands found in standard system binary directories, and a small curated set
of well-known development tools. It is now frozen and human-reviewed additions are explicit. A false
negative is intentionally safe—it becomes custom_N; no spelling or path heuristic can silently
publish a new project-specific name.
During sanitization, every executable token in command_skeleton passes through the same frozen
whitelist and trace-level custom_N mapping as executables[]. Operators and reserved <...>
structural tokens are retained as-is. An empty skeleton remains empty.
The current proposal retains 351 of 1,044 unique names and covers 99.04% of all executable
occurrences. The remaining 693 names receive stable-within-this-mapping labels in inventory order:
modal → custom_1, collaborative_vibe_coder → custom_2, harbor → custom_18, and
vibe-serve → custom_25. modal remains private in this conservative pass even though it is a
public product; adding it to the whitelist is a deliberate review decision. The mapping file itself
contains sensitive original names and must never be shipped with a public trace.
To rebuild the one-time whitelist from a new inventory, first move/remove the existing whitelist and
run sanitize_executables.py --bootstrap-whitelist. Do not use bootstrap during public sanitization;
the sanitizer reads only the frozen reviewed file and assigns its own first-seen trace-level mapping.
echo heavily as a progress/label
idiom (Claude averages ~2.3 echos per echo-using command); every occurrence is one echo process, so
it counts. It is tagged plumbing, so the --tools-only view drops it."Wall time: N seconds" line, so it
is quantized to whole seconds (values cluster at 1000/2000/…ms; 30000ms ≈ the 30s exec cap). ~41% of
Codex single-exe calls are fast enough to read 0 seconds → 0 ms and are floored to 1 ms rather than
dropped — so a spike at 1 ms in a Codex box is that 0-second cohort. Claude’s come from millisecond
timestamps and are fine-grained.